Fig. 1
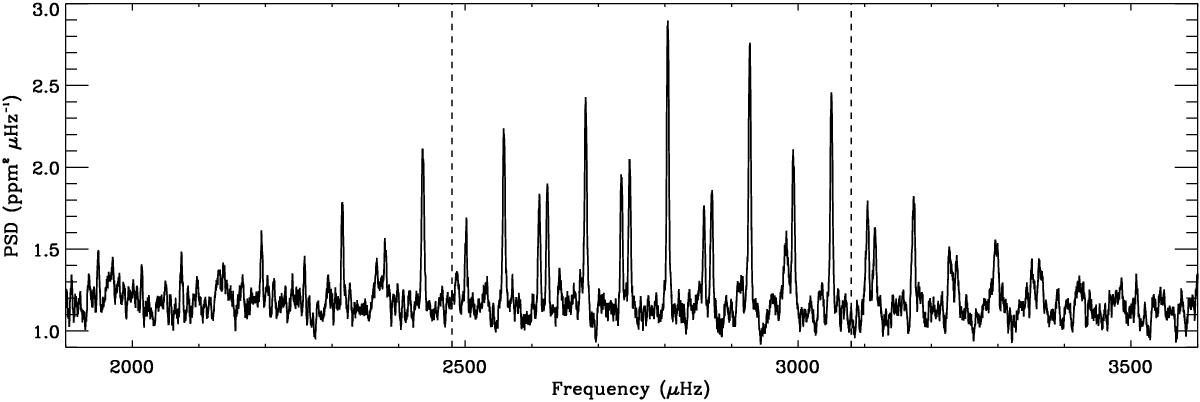
Power spectrum of KIC 10644253 observed by the Kepler satellite centered on the frequency range of the measured acoustic oscillations and obtained by averaging the analyzed 180-day power spectra having a duty cycle higher than 80% and smoothed over 4 μHz. The vertical dashed lines indicate the frequency range chosen for analyzing the frequency shifts.
Current usage metrics show cumulative count of Article Views (full-text article views including HTML views, PDF and ePub downloads, according to the available data) and Abstracts Views on Vision4Press platform.
Data correspond to usage on the plateform after 2015. The current usage metrics is available 48-96 hours after online publication and is updated daily on week days.
Initial download of the metrics may take a while.