Fig. 7
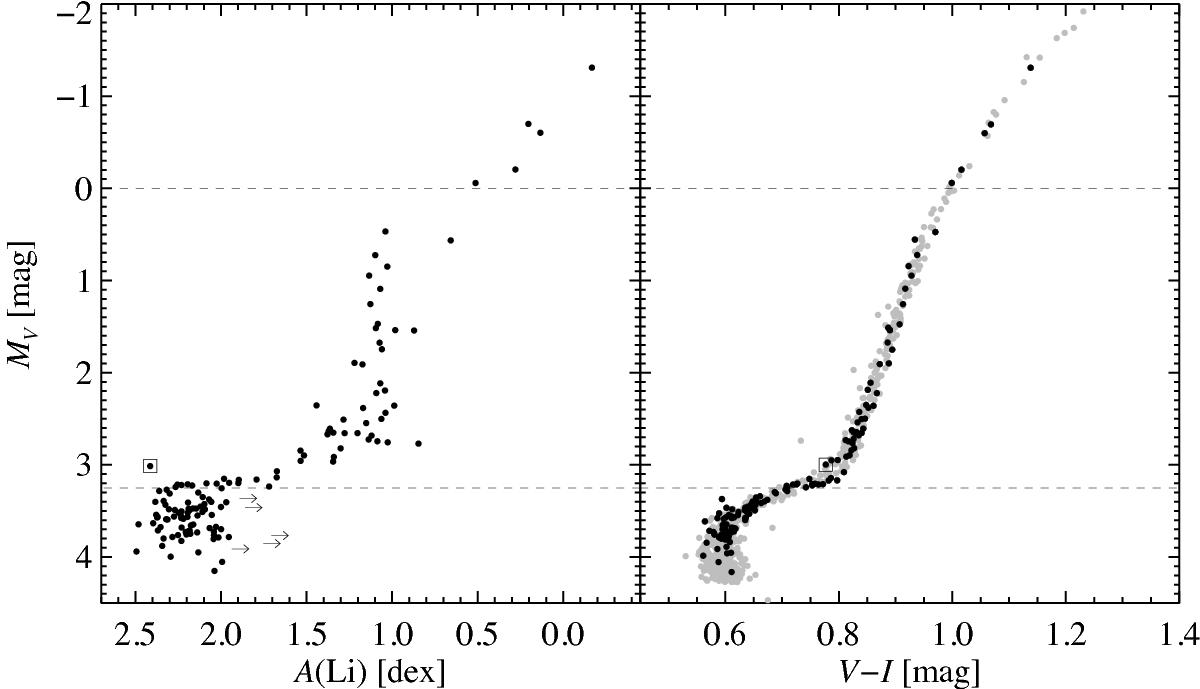
Left: derived NLTE Li abundances as a function of the ordinate absolute visual magnitude (MV = V−14.73). Right: CMD of M30. Our spectroscopic targets are marked by the black circles. The two horizontal dashed lines mark the locations where the Li abundance rapidly decreases as a result of stellar evolution. The square marks the Li-rich subgiant in the two plots (see text).
Current usage metrics show cumulative count of Article Views (full-text article views including HTML views, PDF and ePub downloads, according to the available data) and Abstracts Views on Vision4Press platform.
Data correspond to usage on the plateform after 2015. The current usage metrics is available 48-96 hours after online publication and is updated daily on week days.
Initial download of the metrics may take a while.