Fig. 6
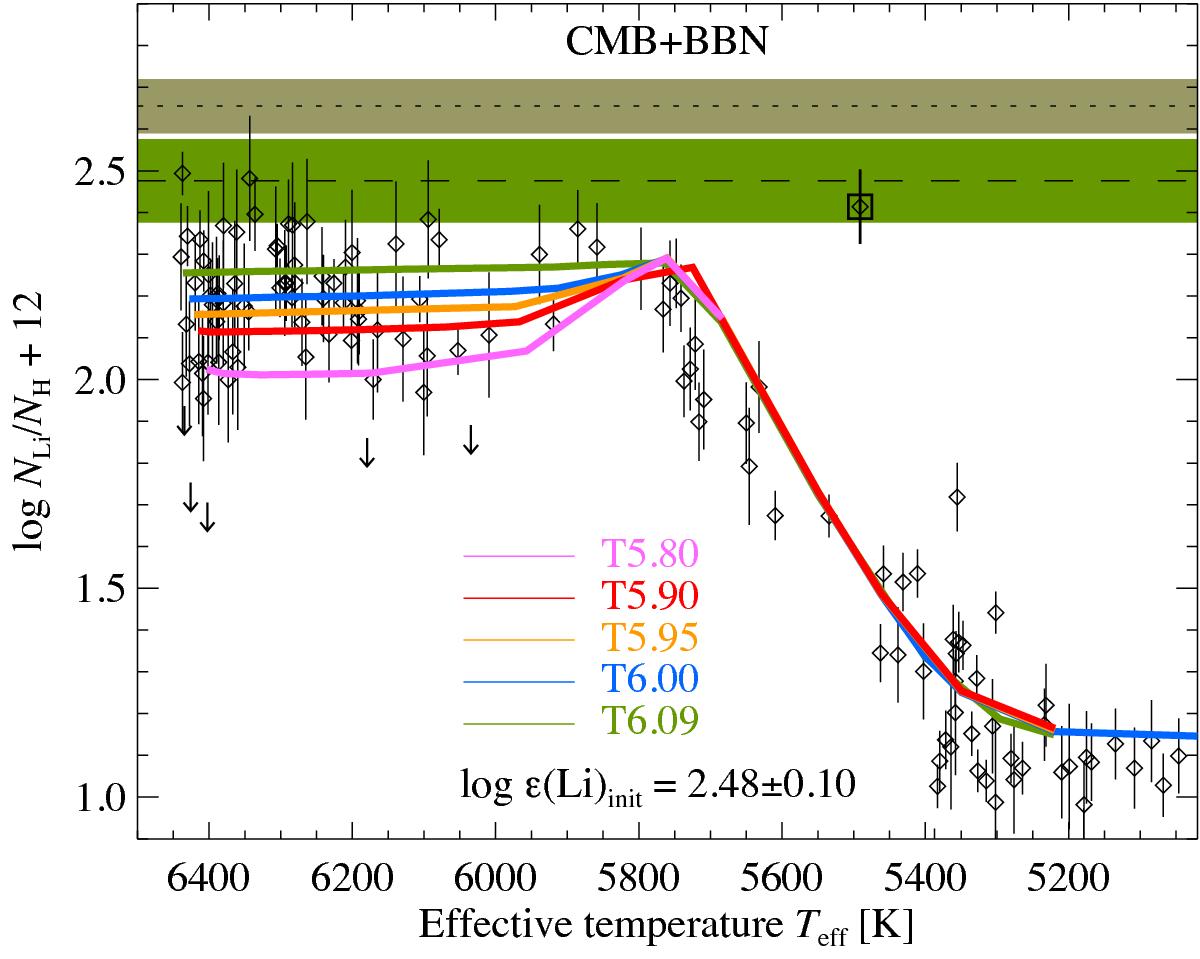
Evolution of lithium compared to the prediction by Big Bang Nucleosynthesis (BBNS) given by the dotted line. The diamonds represent the observed Li abundances with their corresponding measurement error bars. The arrows represent upper limits. The square shows the Li-rich subgiant. Overplotted are predictions from stellar structure models including atomic diffusion and different efficiencies of AddMix. The initial abundance and corresponding uncertainty on the derived Li abundance are given by the dashed line and the shaded region, respectively. They have been adjusted so that predictions match the observed abundance level at the cool end of the Teff scale. The shaded region around the dotted line gives the uncertainty interval of the Planck-calibrated primordial lithium abundance.
Current usage metrics show cumulative count of Article Views (full-text article views including HTML views, PDF and ePub downloads, according to the available data) and Abstracts Views on Vision4Press platform.
Data correspond to usage on the plateform after 2015. The current usage metrics is available 48-96 hours after online publication and is updated daily on week days.
Initial download of the metrics may take a while.