Fig. 5
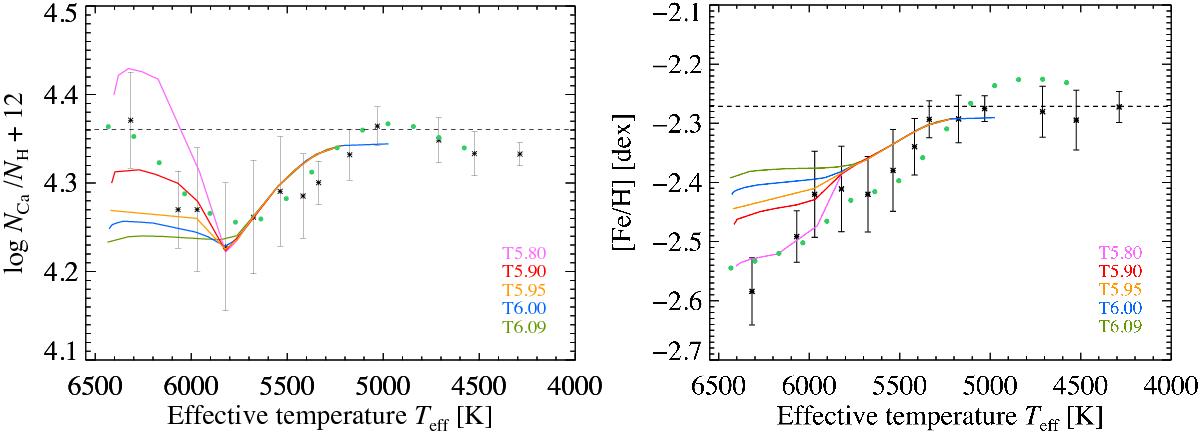
Average abundance trends from Fig. 4 given by the (green) bullets with the abundances of the coadded group-spectra overplotted. In both panels, predictions from stellar structure models including atomic diffusion with additional mixing with different efficiencies are overplotted. The dashed horizontal lines represent the initial abundances of the models, which have been adjusted so that predictions match the observed abundance level at the cool end of the Teff scale.
Current usage metrics show cumulative count of Article Views (full-text article views including HTML views, PDF and ePub downloads, according to the available data) and Abstracts Views on Vision4Press platform.
Data correspond to usage on the plateform after 2015. The current usage metrics is available 48-96 hours after online publication and is updated daily on week days.
Initial download of the metrics may take a while.