Fig. 4
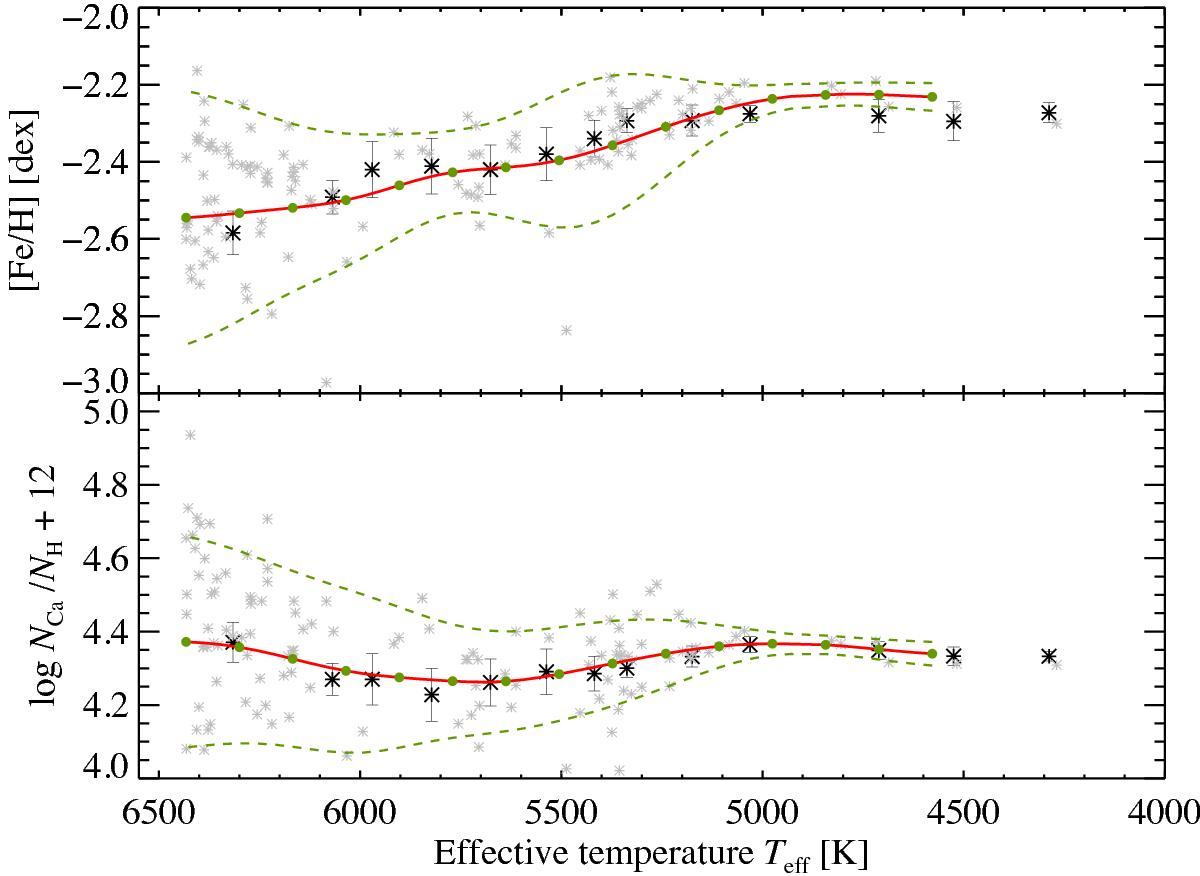
Derived NLTE abundances as a function of the effective temperature Teff for Fe and Ca from the analysis of 144 stars. The solid (red) lines represent the running mean (weighted average), the dashed (green) lines give the standard deviation. Overplotted are the derived abundances from the coadded group-spectra with their respective statistical errors.
Current usage metrics show cumulative count of Article Views (full-text article views including HTML views, PDF and ePub downloads, according to the available data) and Abstracts Views on Vision4Press platform.
Data correspond to usage on the plateform after 2015. The current usage metrics is available 48-96 hours after online publication and is updated daily on week days.
Initial download of the metrics may take a while.