Fig. 3
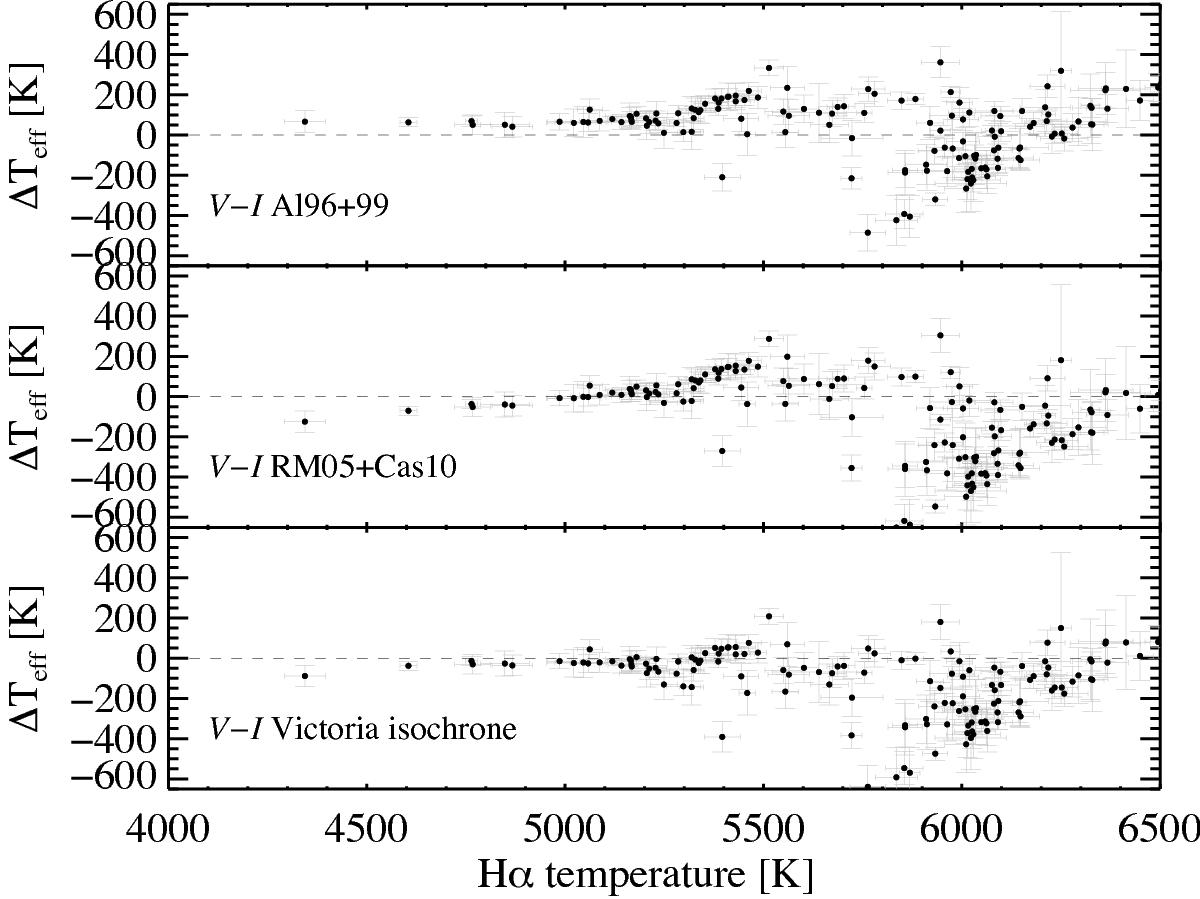
Comparison between the Hα-based Teff scale and the photometric Teff scales obtained by applying the calibrated relations of Alonso et al. (1996, 1999) and Casagrande et al. (2010)+ Ramírez & Meléndez (2005), to colour indices V−I. The y-axis shows ΔTeff = Teff(Hα) −Teff(photometry) for the calibrations. For stars with temperatures below 4950 K, the excitation temperatures are shown. The corresponding error bars are overplotted in grey. Horizontal error bars correspond to the fitting uncertainty, vertical error bars represent the uncertainty in the photometric temperatures as given by the spread in colour around the fiducial, added in quadrature with the uncertainty in the spectroscopic temperatures as given by the fitting error.
Current usage metrics show cumulative count of Article Views (full-text article views including HTML views, PDF and ePub downloads, according to the available data) and Abstracts Views on Vision4Press platform.
Data correspond to usage on the plateform after 2015. The current usage metrics is available 48-96 hours after online publication and is updated daily on week days.
Initial download of the metrics may take a while.