Fig. 5
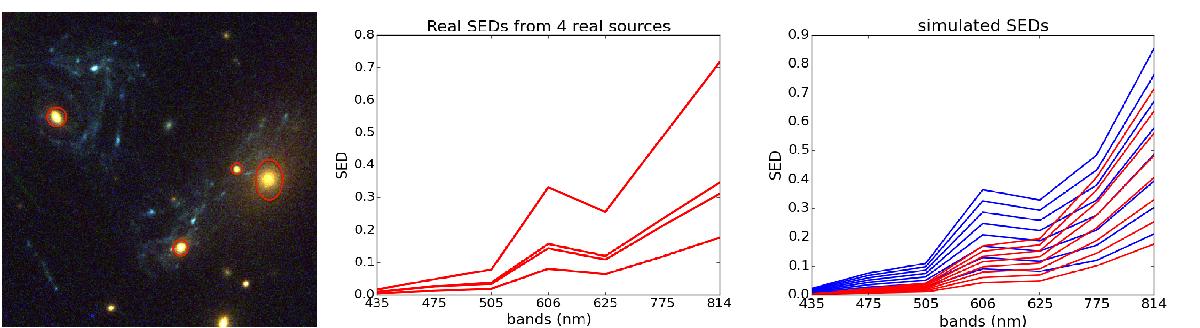
Left: part of an HST image of the galaxy cluster MACS J1149+2223, where the four objects used to extract SEDs are indicated with red contours. Middle: extracted SEDs. Each curve corresponds to the SEDs of the galaxies circled in red in the first panel. Right: simulated SEDs. The seven red SEDs are used to produce the upper row of galaxies in Fig. 6. The blue SEDs correspond to the lower row of galaxies (see text).
Current usage metrics show cumulative count of Article Views (full-text article views including HTML views, PDF and ePub downloads, according to the available data) and Abstracts Views on Vision4Press platform.
Data correspond to usage on the plateform after 2015. The current usage metrics is available 48-96 hours after online publication and is updated daily on week days.
Initial download of the metrics may take a while.