Fig. 2
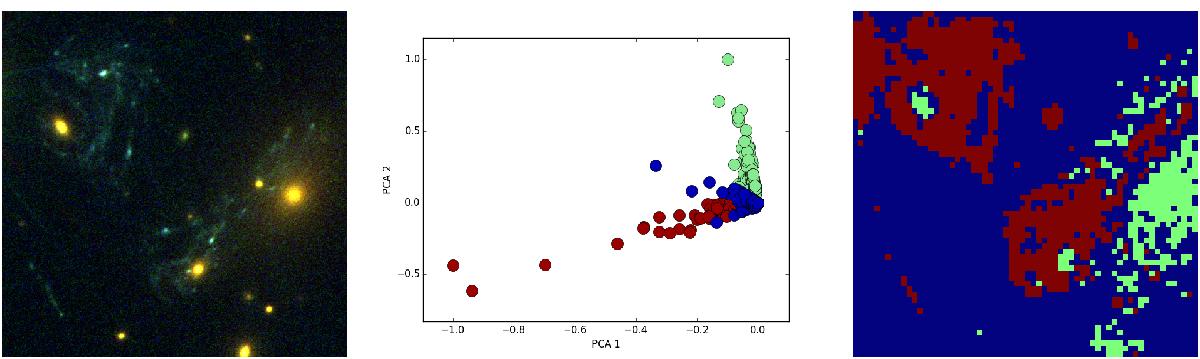
Illustration of the PCA colour selection. Left: HST image of the “Refsdal lens” in the galaxy cluster MACS J1149.6+2223. Middle: distribution of the first two PCA coefficients. The red and green dots correspond to the coefficients attributed to the first and second sources by MuSCADeT, respectively. Blue dots are rejected coefficients. Right: corresponding spatial distribution of colours as detected via PCA.
Current usage metrics show cumulative count of Article Views (full-text article views including HTML views, PDF and ePub downloads, according to the available data) and Abstracts Views on Vision4Press platform.
Data correspond to usage on the plateform after 2015. The current usage metrics is available 48-96 hours after online publication and is updated daily on week days.
Initial download of the metrics may take a while.