Free Access
Fig. B.1
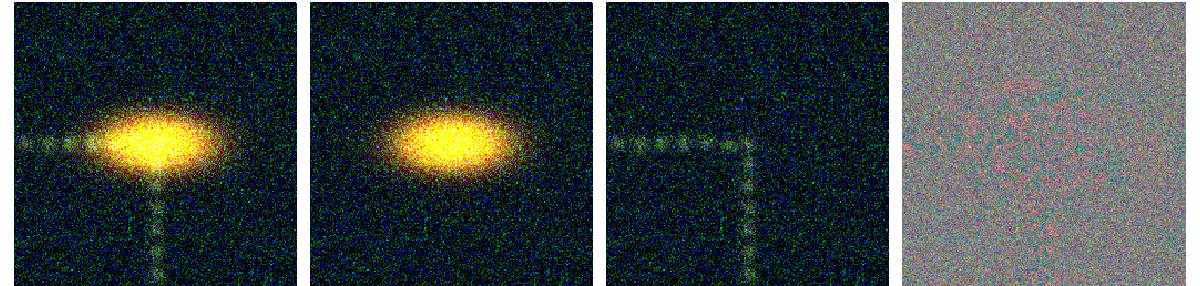
Separation of blended sources at low S/N. From left to right are shown the original simulated images, the original image after subtraction of the blue component as estimated from MuSCADeT, the original image after subtraction of the red component and the residual image after subtraction of both components.
Current usage metrics show cumulative count of Article Views (full-text article views including HTML views, PDF and ePub downloads, according to the available data) and Abstracts Views on Vision4Press platform.
Data correspond to usage on the plateform after 2015. The current usage metrics is available 48-96 hours after online publication and is updated daily on week days.
Initial download of the metrics may take a while.