Fig. 1
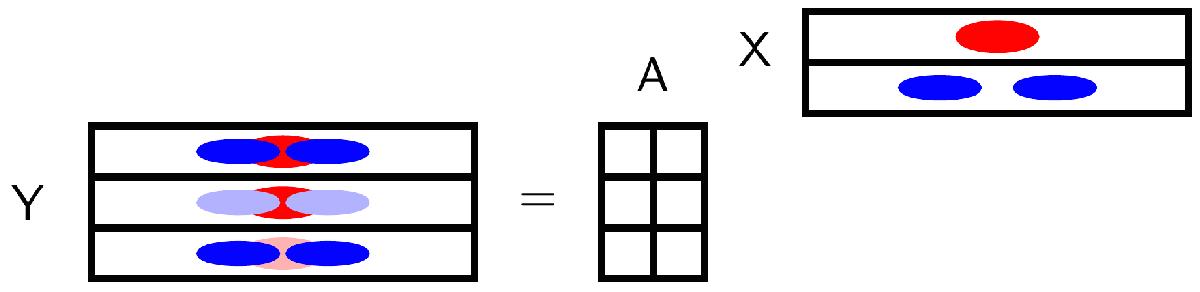
Illustration of the blind source separation in the case of two sources. To make the figure simple, the images in each band are represented as lines in the Y matrix. Sources are lines in the X matrix. On the sketch we figure a red object in the first source and two blue objects in the second source. Matrix A contains the mixing coefficients that allow various combinations of elements of X to produce Y.
Current usage metrics show cumulative count of Article Views (full-text article views including HTML views, PDF and ePub downloads, according to the available data) and Abstracts Views on Vision4Press platform.
Data correspond to usage on the plateform after 2015. The current usage metrics is available 48-96 hours after online publication and is updated daily on week days.
Initial download of the metrics may take a while.