Fig. 6
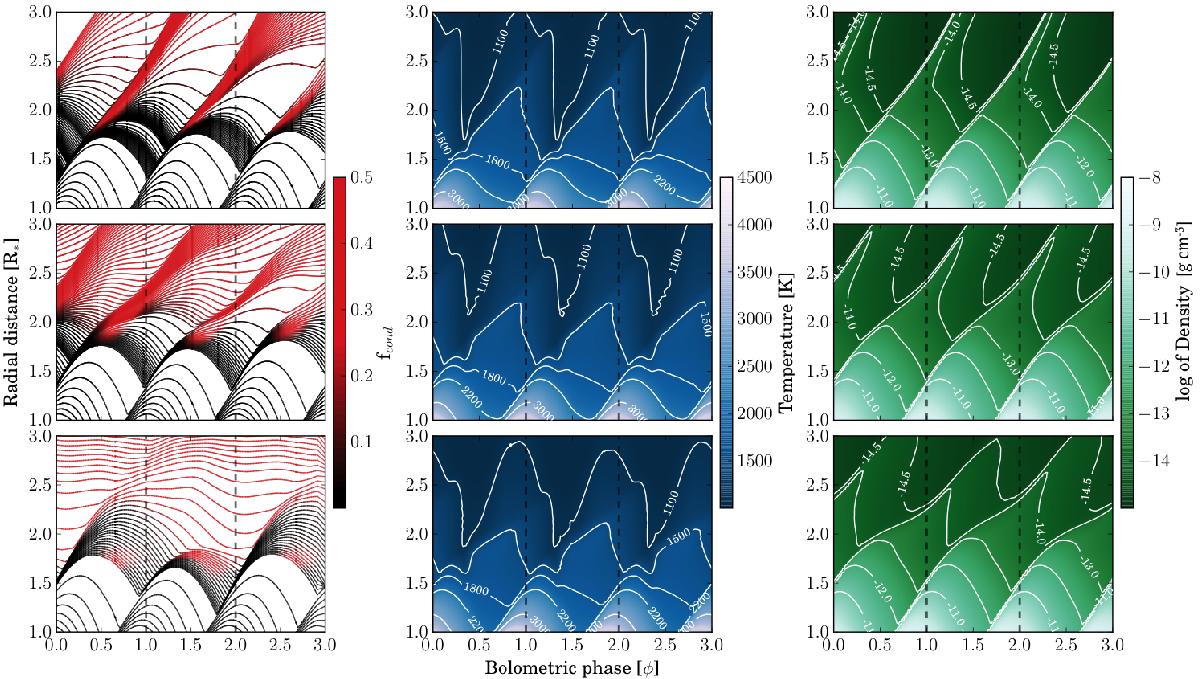
Case M-PL. Dynamical structure of Model M for three different phase shifts. Upper row: Δφp = + 0.09. Middle row: Δφp = 0.00. Bottom row: Δφp = −0.09. Left column: mass shells with degree of condensation colour-coded. Middle column: gas temperature. The contours are partly picked to indicate where the CO Δv = 2 lines are formed. Right column: density, with contours showing the logarithm of the gas density.
Current usage metrics show cumulative count of Article Views (full-text article views including HTML views, PDF and ePub downloads, according to the available data) and Abstracts Views on Vision4Press platform.
Data correspond to usage on the plateform after 2015. The current usage metrics is available 48-96 hours after online publication and is updated daily on week days.
Initial download of the metrics may take a while.