Free Access
Fig. 9
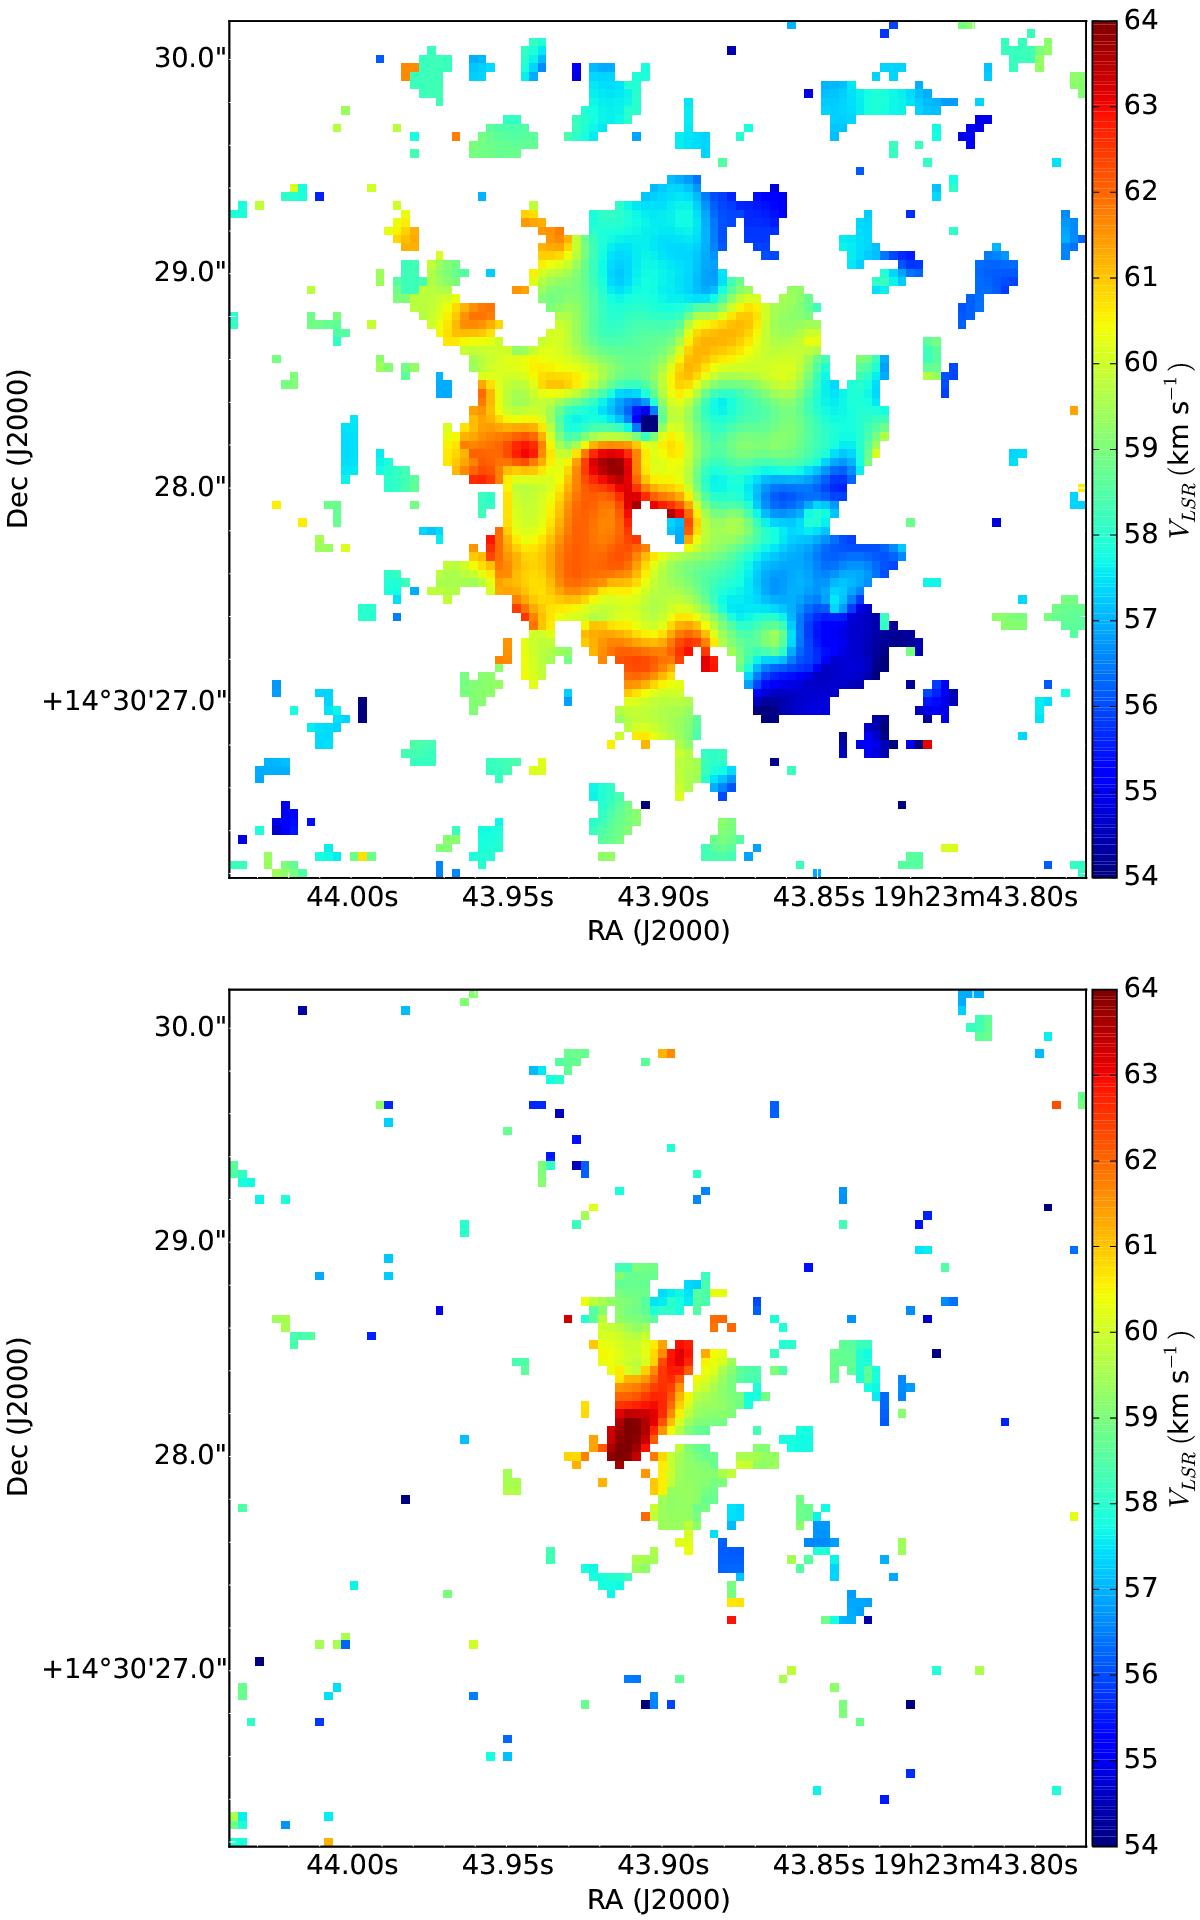
Velocity field of the NH3 (6, 6) inversion line for both the main line (top panel) and the satellite components (bottom panel), as measured in emission toward W51e8. Colors indicate VLSR in km s-1 (color bar). The images were constructed with 0![]() 04 pixels.
04 pixels.
This figure is made of several images, please see below:
Current usage metrics show cumulative count of Article Views (full-text article views including HTML views, PDF and ePub downloads, according to the available data) and Abstracts Views on Vision4Press platform.
Data correspond to usage on the plateform after 2015. The current usage metrics is available 48-96 hours after online publication and is updated daily on week days.
Initial download of the metrics may take a while.