Fig. 5
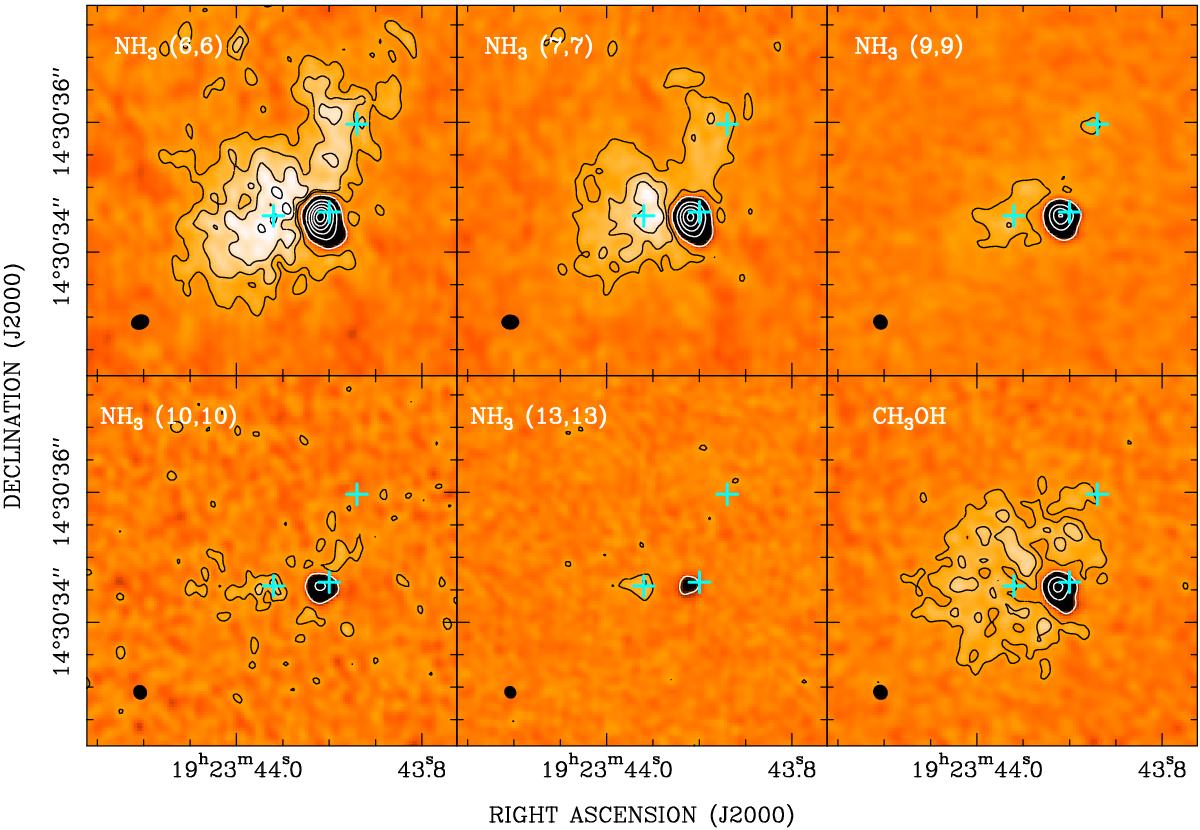
Total intensity images of five inversion transitions of NH3 as well as the CH3OH line toward W51e2. Light colors indicate emission and dark colors absorption. Contours of the NH3 total intensity are also overplotted in the image: emission is displayed with black contours, representing factors 1, 2, 3, 4,.... of 20 mJy beam-1 km s-1; absorption is displayed with white contours, representing factors 1, 5, 9, 13,.... of –50 mJy beam-1 km s-1, for each transition, respectively. The images were integrated over the velocity range covering the main hyperfine component for each transition (from 48 km s-1 to 70 km s-1). The velocity resolution was smoothed to 0.4 km s-1 for all transitions. The synthesized beams (0![]() 19–0
19–0![]() 26) are shown in the bottom left corner of each panel (see Table 1). The images were constructed with 0
26) are shown in the bottom left corner of each panel (see Table 1). The images were constructed with 0![]() 04 pixels for all transitions. The cyan crosses mark the positions of the 0.8 mm continuum peaks identified by Shi et al. (2010a) and corresponding to sources W51e2-E, W51e2-W, and W51e2-NW (from left to right), claimed to be individual high-mass YSOs.
04 pixels for all transitions. The cyan crosses mark the positions of the 0.8 mm continuum peaks identified by Shi et al. (2010a) and corresponding to sources W51e2-E, W51e2-W, and W51e2-NW (from left to right), claimed to be individual high-mass YSOs.
Current usage metrics show cumulative count of Article Views (full-text article views including HTML views, PDF and ePub downloads, according to the available data) and Abstracts Views on Vision4Press platform.
Data correspond to usage on the plateform after 2015. The current usage metrics is available 48-96 hours after online publication and is updated daily on week days.
Initial download of the metrics may take a while.