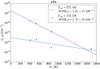
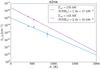
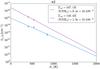
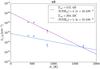
Fig. A.2

Rotational NH3 temperatures determined for the protostars W51e2-E and W51e2-NW, and cores W51e2 and W51e8 (from left to right, and from top to bottom). The temperatures are fit to the slope of the normalized NH3 column density Nu (in units of cm-3) plotted against the energy of each transition Eu (in units of Kelvins) using Eq. (A.8). The blue line is a fit to the measured columns without opacity correction. The magenta line is the fit after applying the opacity corrections, using the optical depth values in Table 3. We excluded the (10, 10) transition from the fit because of much higher rms.
Current usage metrics show cumulative count of Article Views (full-text article views including HTML views, PDF and ePub downloads, according to the available data) and Abstracts Views on Vision4Press platform.
Data correspond to usage on the plateform after 2015. The current usage metrics is available 48-96 hours after online publication and is updated daily on week days.
Initial download of the metrics may take a while.