Fig. 2
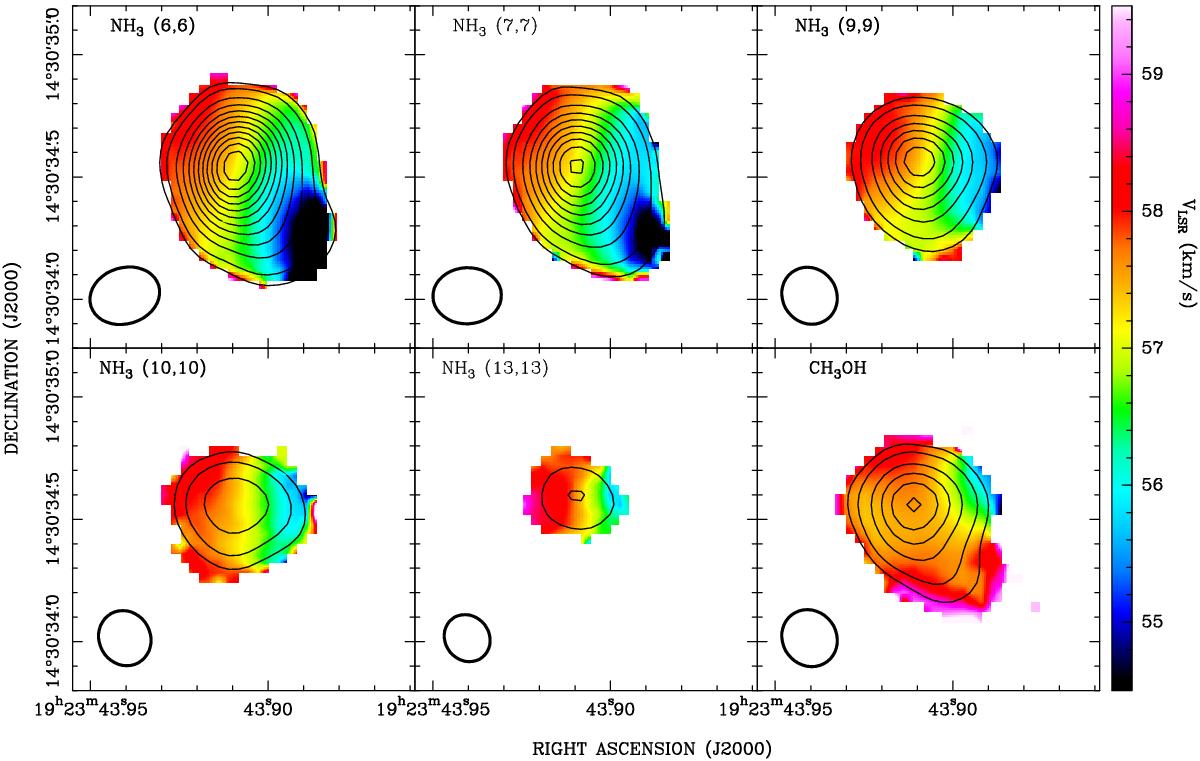
Velocity fields of five inversion transitions of NH3 as well as the CH3OH line, as measured in absorption toward the HC HII region W51e2-W with the JVLA B-array. The total intensity 0th moment maps (contours) are overlaid on the velocity field 1st moment maps (images). Colors indicate VLSR in km s-1. The images were constructed with a 0![]() 04 pixel for all transitions. The contours represent factors 1, 2, 4, 6,.... of −50 mJy beam-1 km s-1, for all transitions. A flux cutoff of −5 mJy beam-1 (~3σ) was used to create 1st moment maps for the (6, 6), (7, 7), and (9, 9) transitions, and a slightly higher cutoff of –7 mJy beam-1 for the (10, 10) and (13, 13) transitions. We note that while the lower excitation transitions (6, 6) and (7, 7) show an apparent velocity gradient along NE-SW, higher excitation lines consistently show a gradient along E-W. We ascribe this difference to a weaker component with blueshifted velocity detected toward SW in the lower excitation lines. The synthesized beams (0
04 pixel for all transitions. The contours represent factors 1, 2, 4, 6,.... of −50 mJy beam-1 km s-1, for all transitions. A flux cutoff of −5 mJy beam-1 (~3σ) was used to create 1st moment maps for the (6, 6), (7, 7), and (9, 9) transitions, and a slightly higher cutoff of –7 mJy beam-1 for the (10, 10) and (13, 13) transitions. We note that while the lower excitation transitions (6, 6) and (7, 7) show an apparent velocity gradient along NE-SW, higher excitation lines consistently show a gradient along E-W. We ascribe this difference to a weaker component with blueshifted velocity detected toward SW in the lower excitation lines. The synthesized beams (0![]() 19–0
19–0![]() 26) are shown in the bottom left corner of each panel (see Table 1).
26) are shown in the bottom left corner of each panel (see Table 1).
Current usage metrics show cumulative count of Article Views (full-text article views including HTML views, PDF and ePub downloads, according to the available data) and Abstracts Views on Vision4Press platform.
Data correspond to usage on the plateform after 2015. The current usage metrics is available 48-96 hours after online publication and is updated daily on week days.
Initial download of the metrics may take a while.