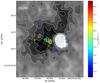
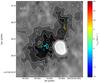
Fig. 15
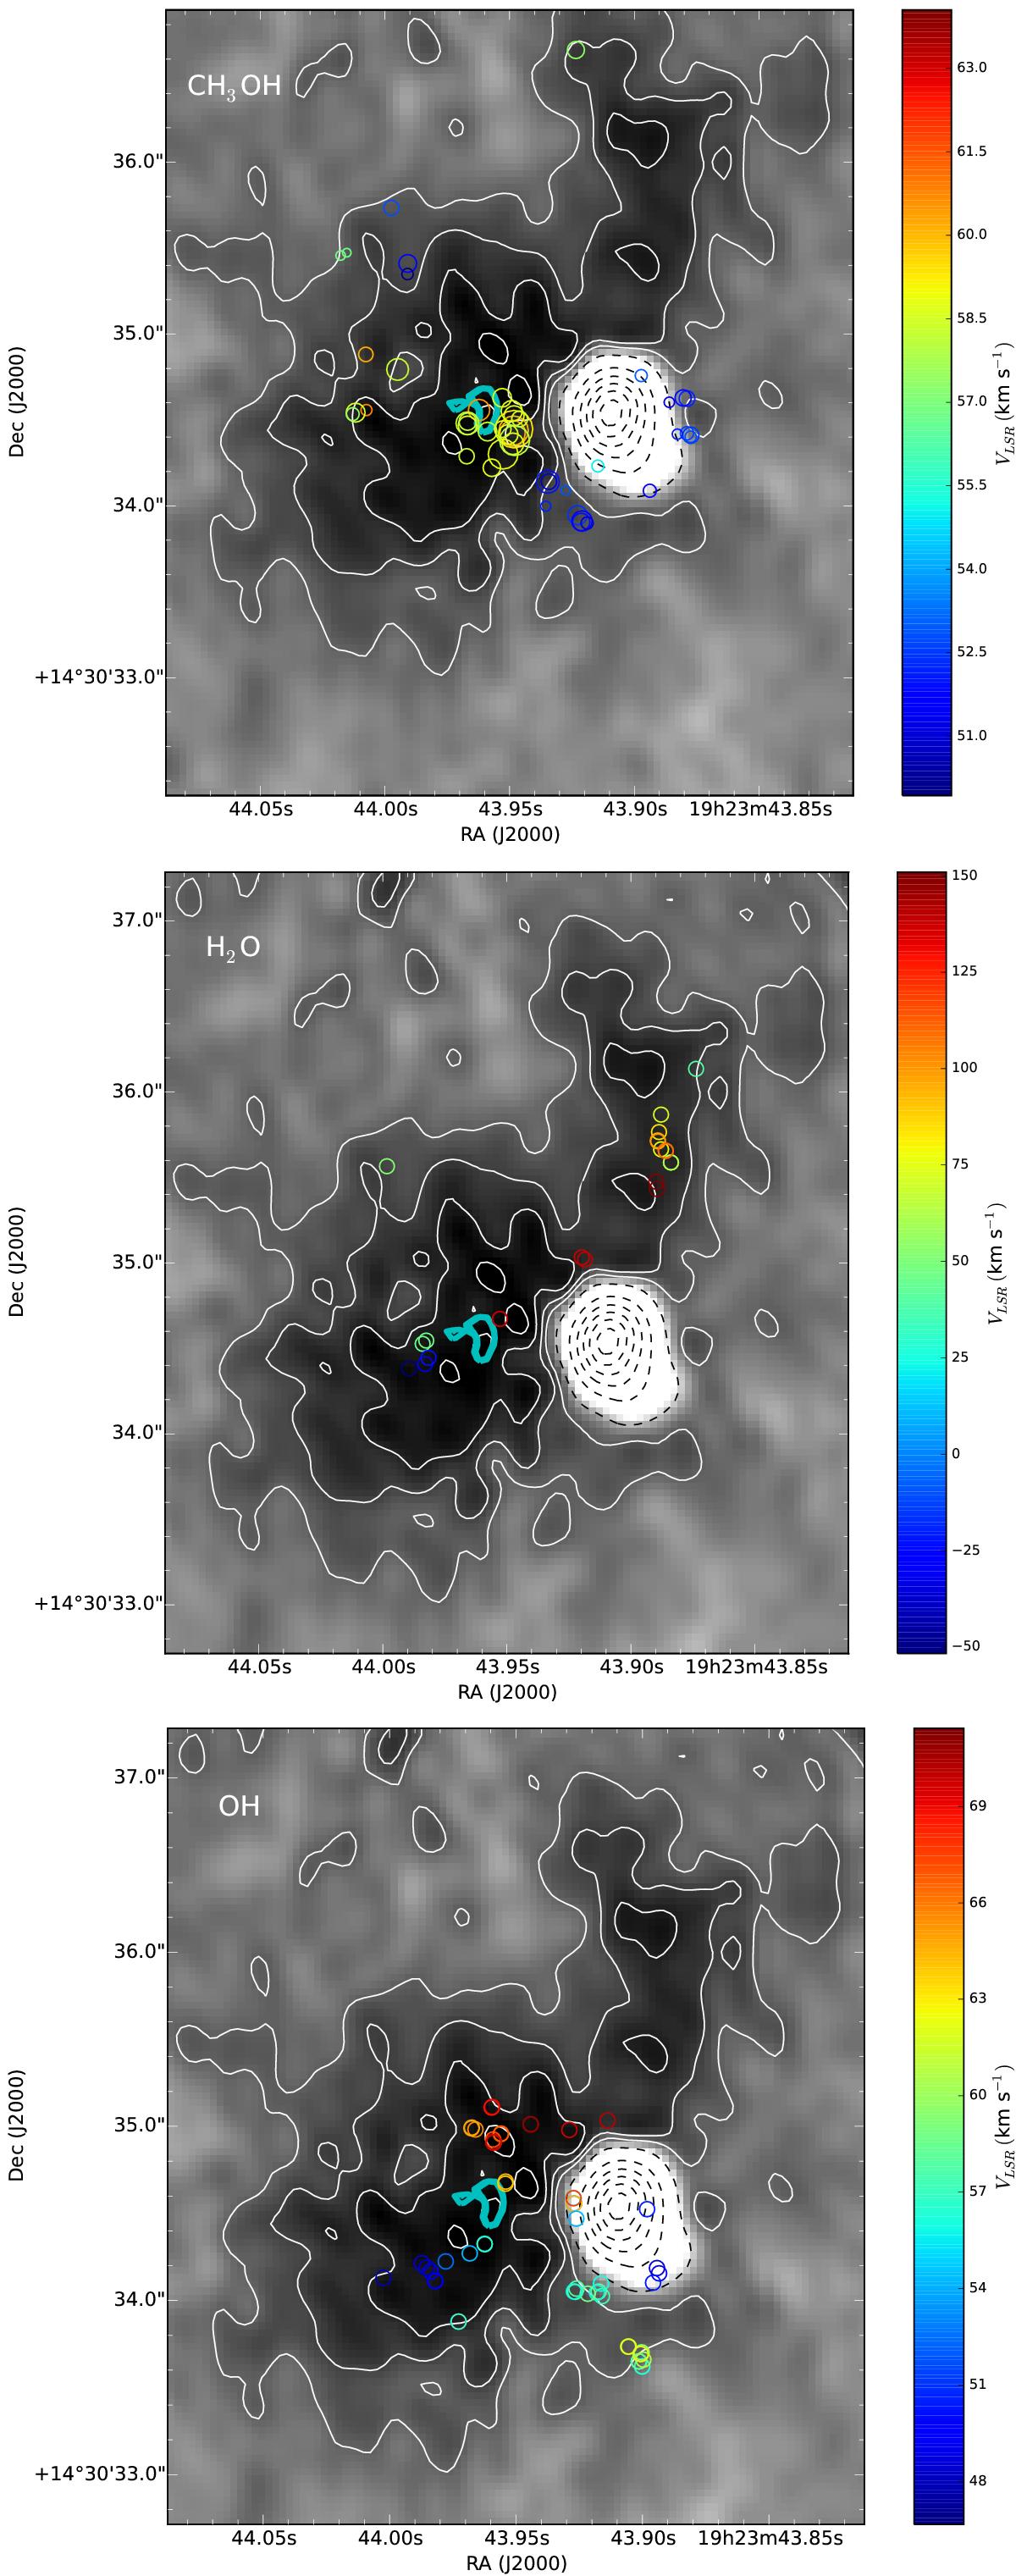
Overlay of molecular masers detected around W51e2 onto the total intensity (0th moment) map of the (6, 6) inversion transition of NH3 (gray scale and white+black contours). The circles show positions of CH3OH masers detected with MeRLIN (Etoka et al. 2012, top panel), H2O masers detected with the VLBA (Sato et al. 2010, middle panel), and OH masers detected with the VLBA (Fish & Reid 2007, bottom panel), respectively. Colors denote l.o.s. velocity in km s-1 (color scale on the right-hand side in each panel). The NH3 emission is shown with white contours, representing 20% to 100% with steps of 20% of the line peak for the (6, 6) line, 107 mJy beam-1 km s-1. The NH3 absorption is shown with black contours, representing factors 1, 5, 9,.... of −50 mJy beam-1. The cyan contour locates the peak of the total intensity map of the most highly excited NH3 transitions (13, 13); the bulk of CH3OH maser emission concentrates around the same peak. We assume that its position pinpoints the high-mass YSO W51e2-E.
Current usage metrics show cumulative count of Article Views (full-text article views including HTML views, PDF and ePub downloads, according to the available data) and Abstracts Views on Vision4Press platform.
Data correspond to usage on the plateform after 2015. The current usage metrics is available 48-96 hours after online publication and is updated daily on week days.
Initial download of the metrics may take a while.