Fig. 14
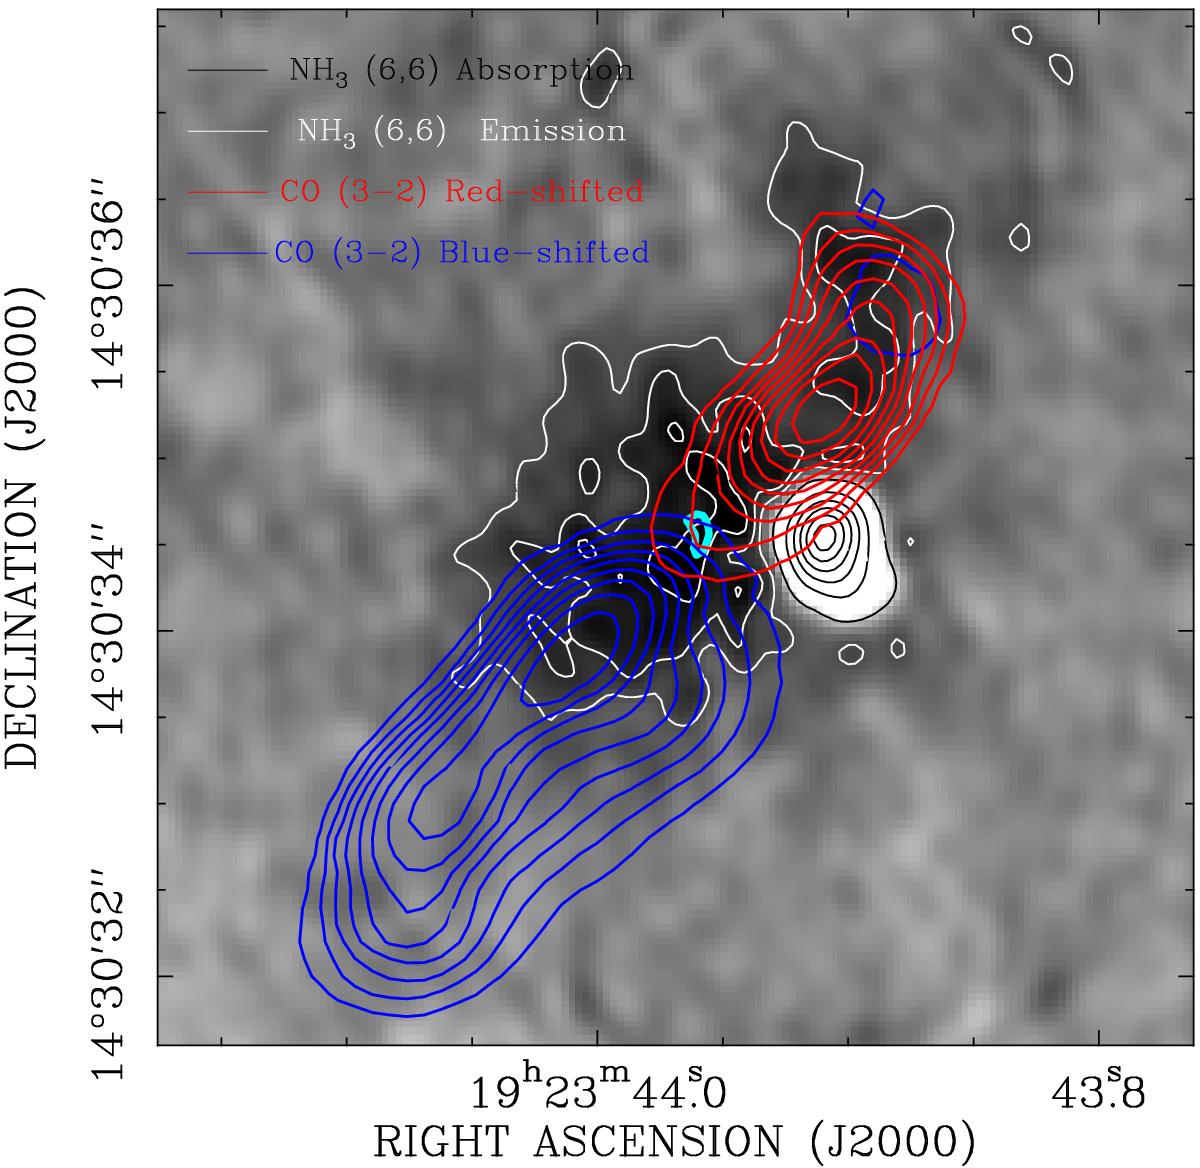
Overlay of the CO J = 3–2 0th moment image from the SMA (blue and red contours; Shi et al. 2010b) onto the total intensity (0th moment) map of the (6, 6) inversion transition of NH3 (gray scale and white+black contours). The NH3 emission is shown with white contours, representing 30% to 90% with steps of 20% of the line peak for the (6, 6) line, 107 mJy beam-1 km s-1. The NH3 absorption is shown with black contours, representing factors 1, 5, 9,.... of –50 mJy beam-1, for all transitions. The CO 3−2 line contours are from 10% to 90% with steps of 10% of the line peak (67 Jy beam-1 km s-1 for the red contours and 82 Jy beam-1 km s-1 for the blue contours). Blue and red contours correspond to blueshifted and redshifted gas, with integrated velocity ranging from –124 to –12 km s-1 and from +10 to +116 km s-1, respectively. The cyan contour locates the peak of the total intensity map of the most highly excited NH3 transitions (13, 13); we assume that this peak pinpoints the high-mass YSO driving the CO outflow.
Current usage metrics show cumulative count of Article Views (full-text article views including HTML views, PDF and ePub downloads, according to the available data) and Abstracts Views on Vision4Press platform.
Data correspond to usage on the plateform after 2015. The current usage metrics is available 48-96 hours after online publication and is updated daily on week days.
Initial download of the metrics may take a while.