Fig. 13
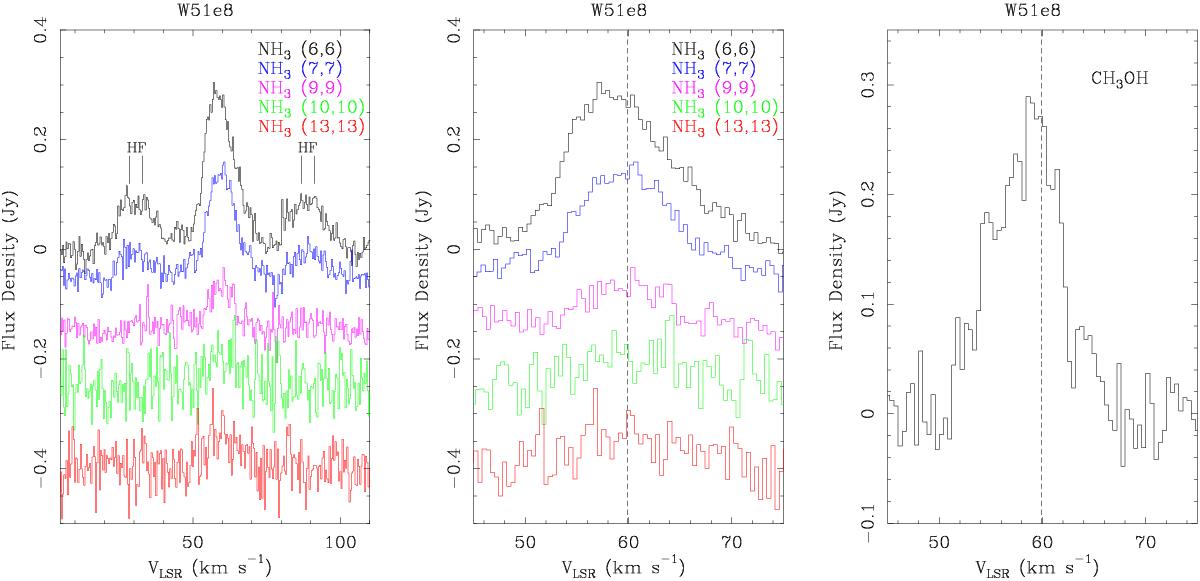
Spectral profiles of emission lines arising from hot molecular gas around W51e8. Left and central panels: spectral profiles of NH3 for transitions (6, 6), (7, 7), (9, 9), (10, 10), and (13, 13). An offset in flux density is applied to transitions adjacent in energy to better display individual profiles. The lower state energy levels of transitions shown here are ~408−1691 K (see Table 1). The hyperfine satellite lines, separated by ~ ± 24−31 km s-1 (see Table 3), are detected for the (6, 6), (7, 7), and (9, 9) lines (left panel). A narrower velocity range is plotted in the central panel to show the line profiles of the main hyperfine component of each inversion transition more clearly. Right panel: spectral profile of the JK = 132–131 line of CH3OH (νrest = 27.473 GHz. The velocity resolution is 0.4 km s-1 (all panels) and the vertical dashed line indicates a velocity of 59.9 km s-1 (central and right panels).
Current usage metrics show cumulative count of Article Views (full-text article views including HTML views, PDF and ePub downloads, according to the available data) and Abstracts Views on Vision4Press platform.
Data correspond to usage on the plateform after 2015. The current usage metrics is available 48-96 hours after online publication and is updated daily on week days.
Initial download of the metrics may take a while.