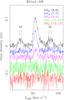
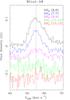
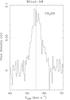
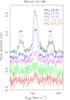
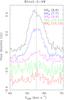
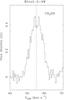
Fig. 12
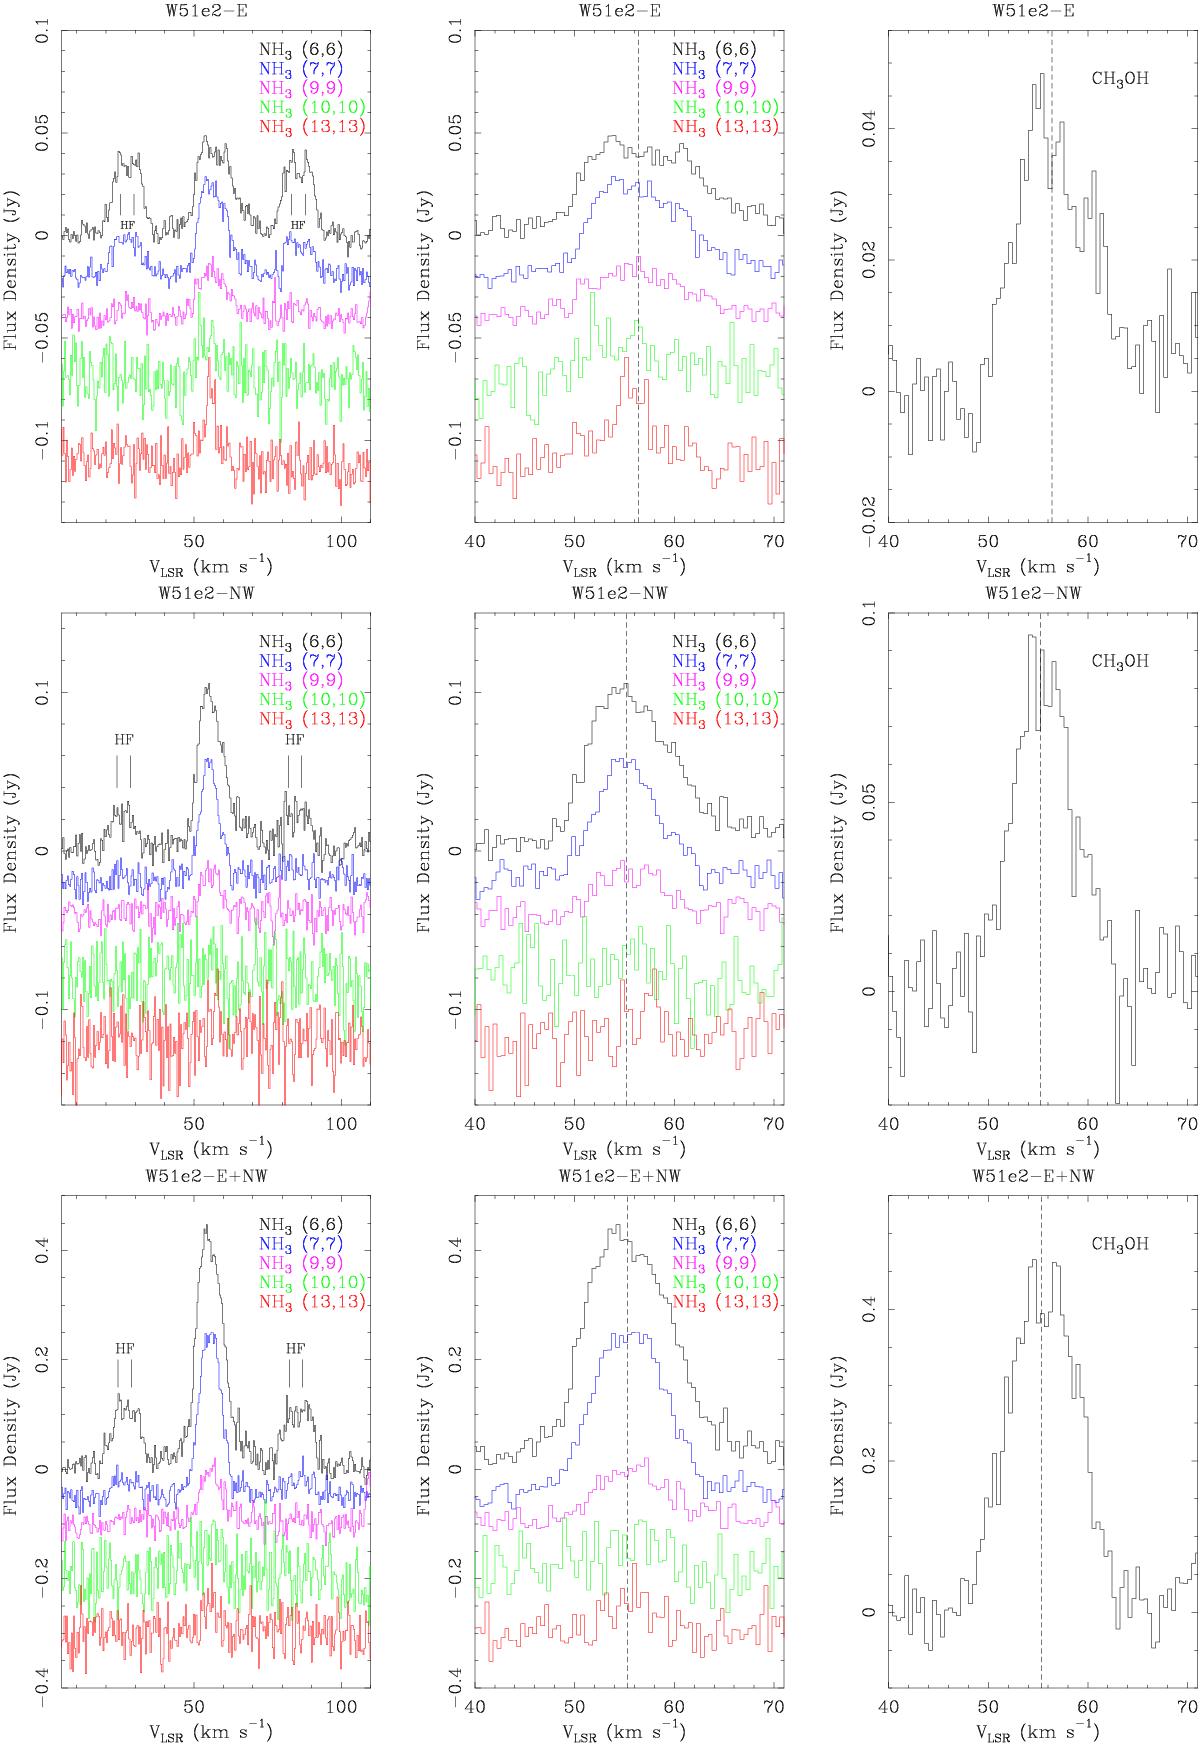
Spectral profiles of emission lines arising from hot molecular gas in the surroundings of the HC HII region. The spectra shown are integrated toward the dust continuum sources W51e2-E (top row), W51e2-NW (middle row), and toward the entire molecular core seen in emission (bottom row), respectively. Left and central panels: spectral profiles of NH3 for transitions (6, 6), (7, 7), (9, 9), (10, 10), and (13, 13). An offset in flux density is applied to transitions adjacent in energy to better display individual profiles. The lower state energy levels of transitions shown here are ~ 408−1691 K (see Table 1). The hyperfine satellite lines, separated by ~ ± 24−31 km s-1 (see Table 3), are clearly detected for the (6, 6), and (7, 7) doublets in the three cases; the (9, 9) HF lines are detected only toward W51e2-E (top row, left panel). A narrower velocity range is plotted in the central panel to show the profiles of the main hyperfine component of each inversion transition more clearly. Right panel: spectral profile of the JK = 132–131 line of CH3OH (νrest = 27.473 GHz). The velocity resolution is 0.4 km s-1 (all panels), and the vertical dashed line in the central and right panels indicate velocities of 56.4 km s-1 (top row), 55.2 km s-1 (middle row), and 55.3 km s-1 (bottom row), respectively.
Current usage metrics show cumulative count of Article Views (full-text article views including HTML views, PDF and ePub downloads, according to the available data) and Abstracts Views on Vision4Press platform.
Data correspond to usage on the plateform after 2015. The current usage metrics is available 48-96 hours after online publication and is updated daily on week days.
Initial download of the metrics may take a while.