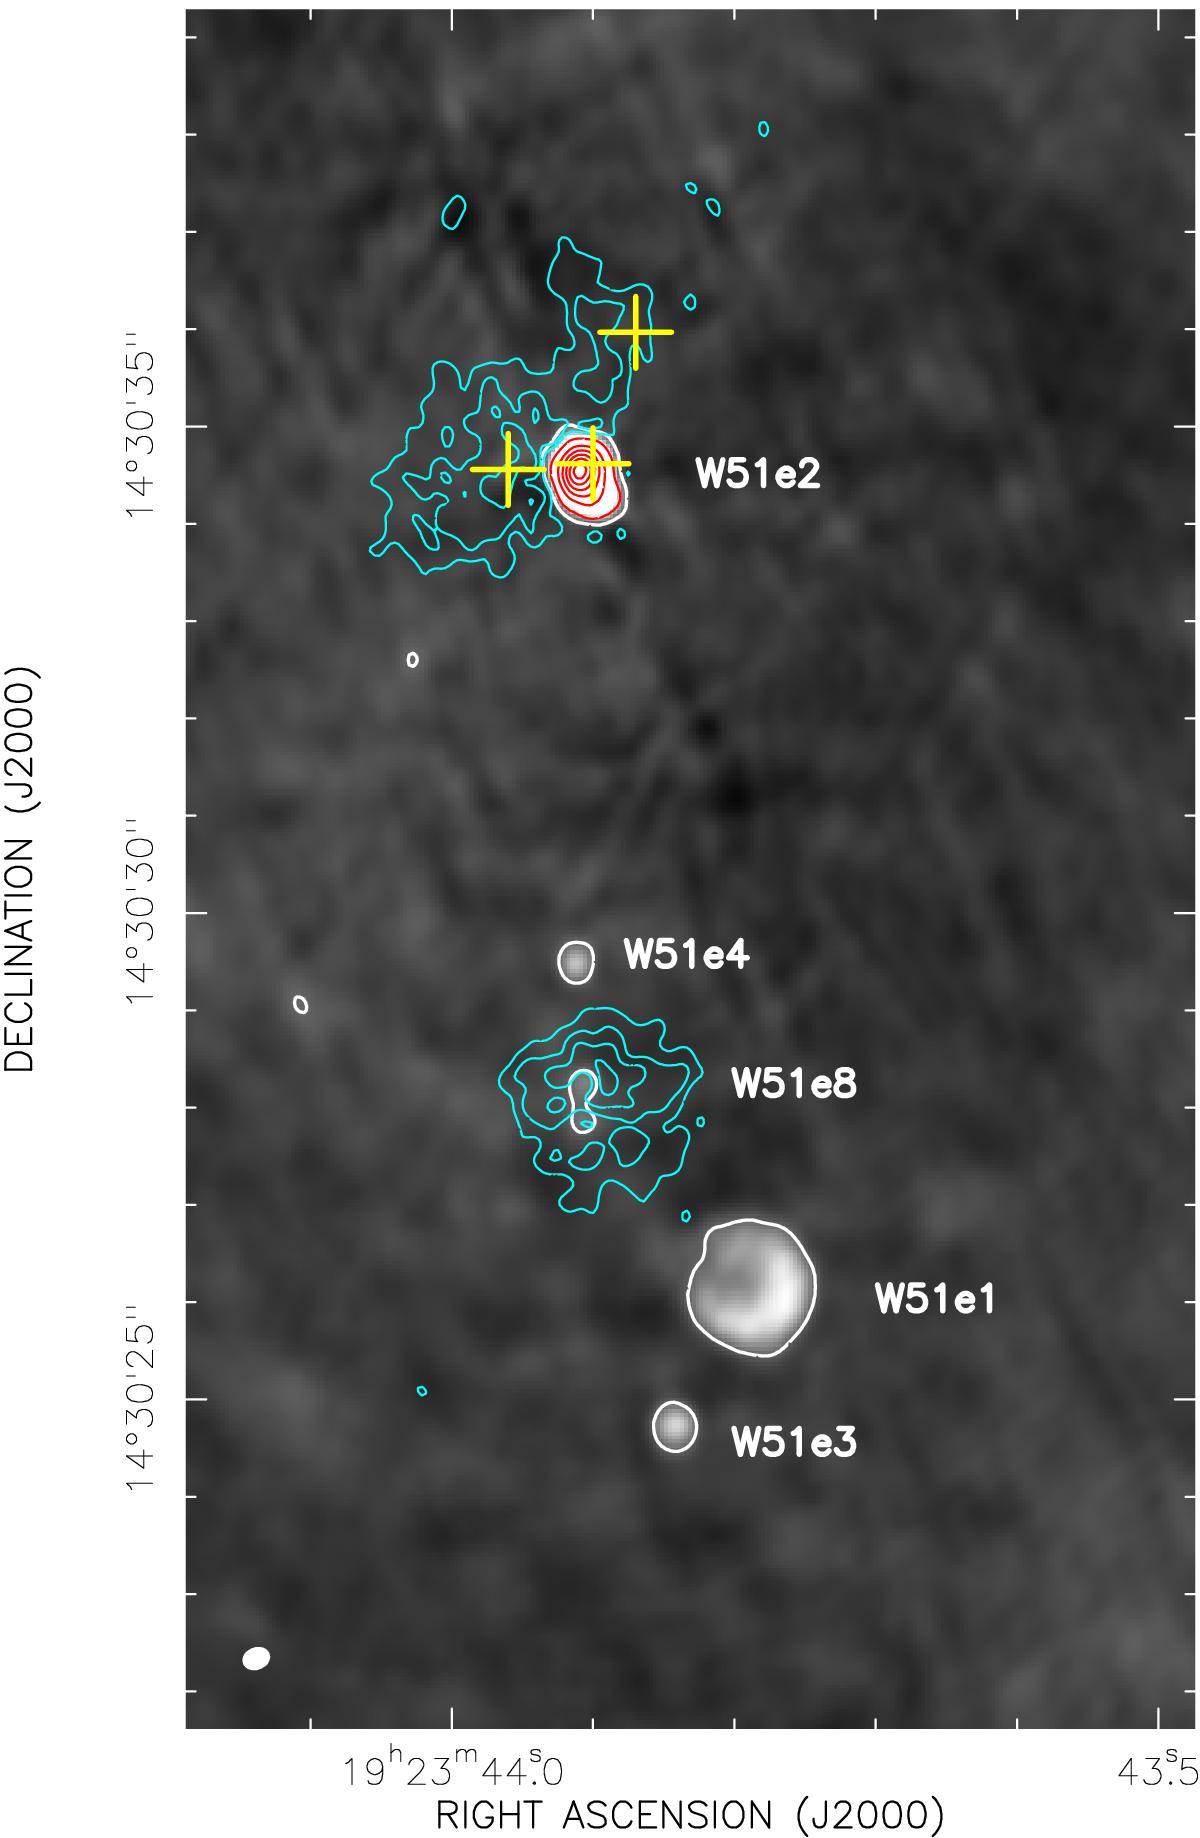
Fig. 1

Distribution of ionized and hot molecular gas in W51 Main as observed with the JVLA-B array. The 25 GHz continuum emission (gray scale and white contours) is produced by the cluster of HII regions W51e1, e2, e3, e4, and e8 (labeled in the plot). The 25 GHz continuum (white) contours indicate 2 mJy flux levels per beam (corresponding to 3σ where σ ~ 0.7 mJy beam-1). The total intensity (0th moment) map of the (6, 6) inversion transition of NH3 is overlaid on the continuum, showing hot and dense molecular gas toward W51e2 and W51e8. The NH3 emission is indicated with cyan contours, representing 30% to 90% with steps of 20% of the line peak for the (6, 6) line, 107 mJy beam-1 km s-1. The NH3 absorption is indicated with red contours, representing factors 1, 5, 9, 13,.... of −50 mJy beam-1 km s-1, for all transitions. No flux cutoff was applied. The images were integrated over the velocity range 48 km s-1 to 70 km s-1, while the velocity resolution was smoothed to 0.4 km s-1. The synthesized beam (0![]() 29×0
29×0![]() 23) is shown in the bottom left corner of the panel. The images were constructed with 0
23) is shown in the bottom left corner of the panel. The images were constructed with 0![]() 04 pixels for all transitions. The yellow crosses around W51e2 indicate the positions of the 0.8 mm continuum peaks identified by Shi et al. (2010a) and correspond to sources W51e2-E, W51e2-W, and W51e2-NW (from left to right), claimed to be individual high-mass YSOs.
04 pixels for all transitions. The yellow crosses around W51e2 indicate the positions of the 0.8 mm continuum peaks identified by Shi et al. (2010a) and correspond to sources W51e2-E, W51e2-W, and W51e2-NW (from left to right), claimed to be individual high-mass YSOs.
Current usage metrics show cumulative count of Article Views (full-text article views including HTML views, PDF and ePub downloads, according to the available data) and Abstracts Views on Vision4Press platform.
Data correspond to usage on the plateform after 2015. The current usage metrics is available 48-96 hours after online publication and is updated daily on week days.
Initial download of the metrics may take a while.


