Free Access
Fig. 3
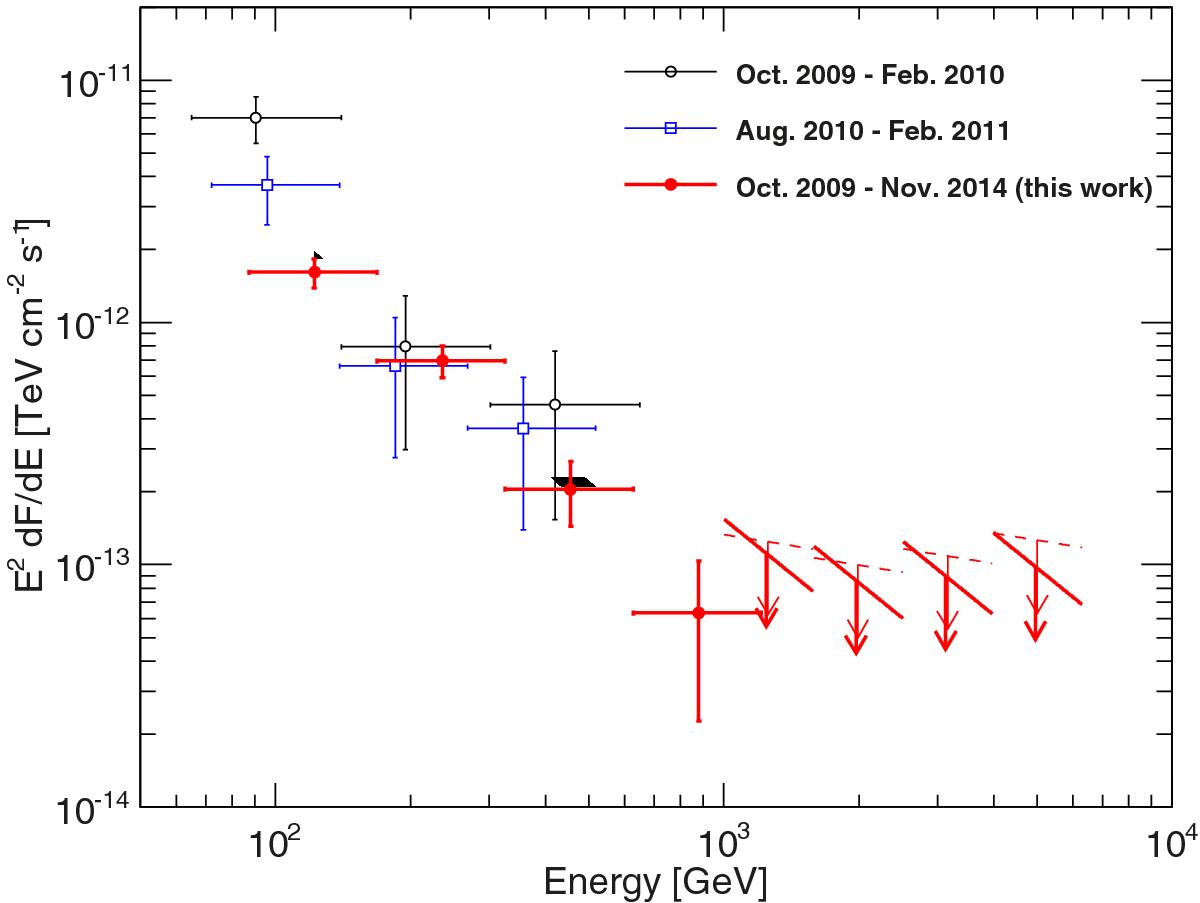
Spectral energy distribution of NGC 1275 averaged over different periods with the newest results in red (~250 h). Arrows indicate the 95%-c.l. differential flux upper limits (5 bins/decade) for a power-law spectrum with a photon index of Γ = 3.5 (thick solid lines) and Γ = 2.3 (thin and dashed lines), respectively.
Current usage metrics show cumulative count of Article Views (full-text article views including HTML views, PDF and ePub downloads, according to the available data) and Abstracts Views on Vision4Press platform.
Data correspond to usage on the plateform after 2015. The current usage metrics is available 48-96 hours after online publication and is updated daily on week days.
Initial download of the metrics may take a while.