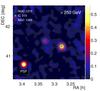
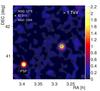
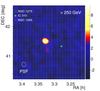
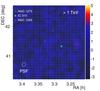
Fig. 1
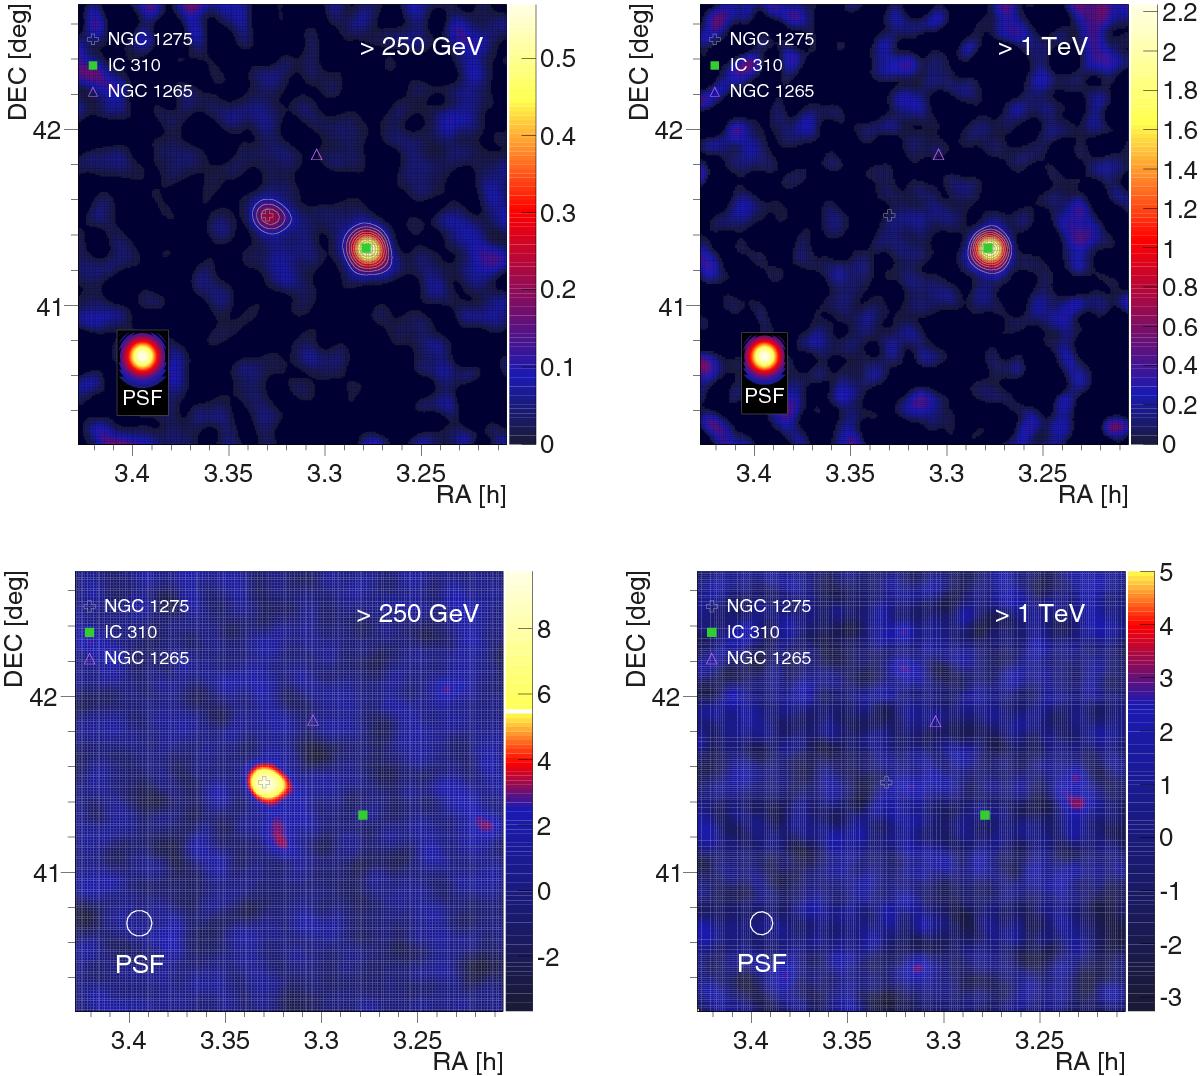
Perseus cluster sky maps for an energy threshold of 250 GeV (left-hand panels) and 1 TeV (right-hand panels) obtained from 253 h of MAGIC observation. Upper panels show the relative flux (colour code, expressed in signal-to-background ratio) and the excess significance (contour lines starting from 4σ with steps of 2σ). Lower panels show the significance maps where the signal from IC 310 is subtracted (see text). Symbols indicate the positions of the three brightest radio galaxies of the cluster.
Current usage metrics show cumulative count of Article Views (full-text article views including HTML views, PDF and ePub downloads, according to the available data) and Abstracts Views on Vision4Press platform.
Data correspond to usage on the plateform after 2015. The current usage metrics is available 48-96 hours after online publication and is updated daily on week days.
Initial download of the metrics may take a while.