Free Access
Fig. 2
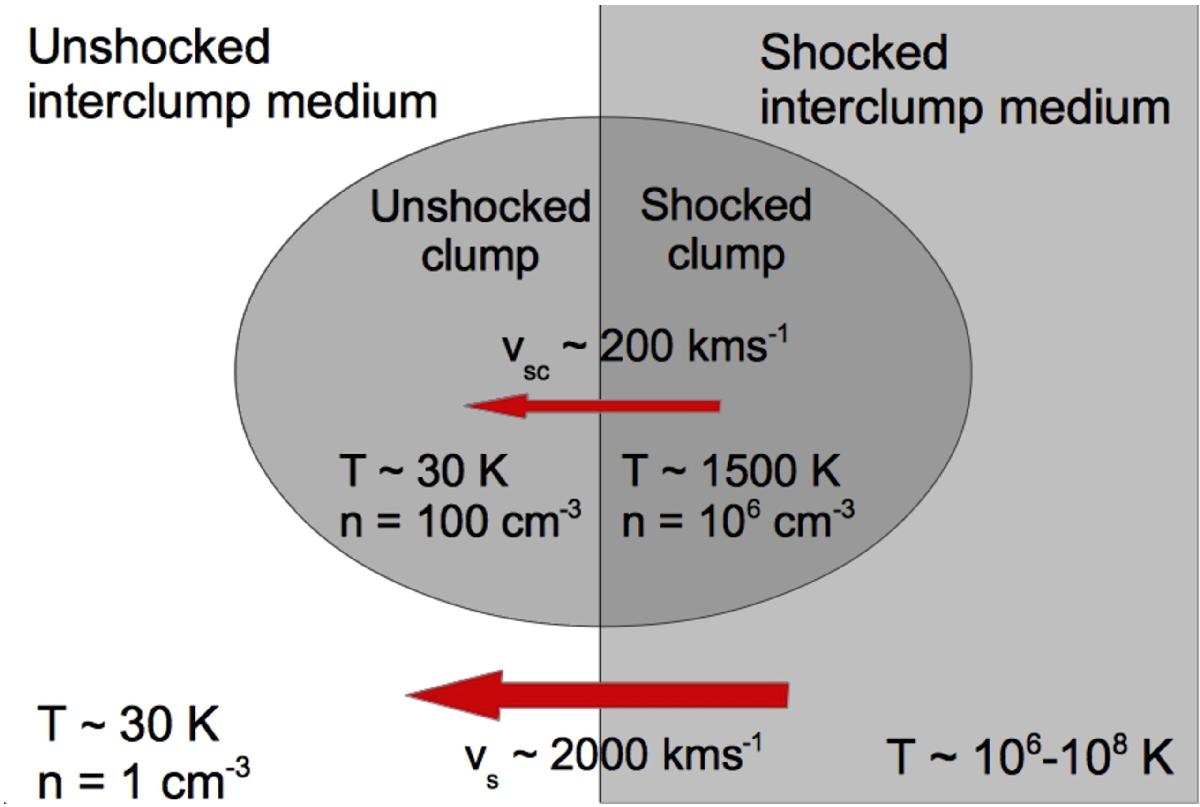
Schematic representation of a shocked clump. The reverse shock is represented by the black line at the centre of the diagram and moves from right to left, as indicated by the red arrows. Pre-shock and post-shock values of the main gas parameters of the clump and inter-clump medium are indicated.
Current usage metrics show cumulative count of Article Views (full-text article views including HTML views, PDF and ePub downloads, according to the available data) and Abstracts Views on Vision4Press platform.
Data correspond to usage on the plateform after 2015. The current usage metrics is available 48-96 hours after online publication and is updated daily on week days.
Initial download of the metrics may take a while.