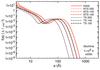
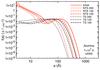
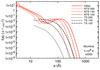
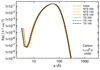
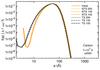
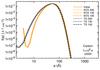
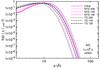
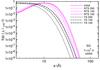
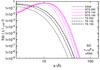
Fig. 10
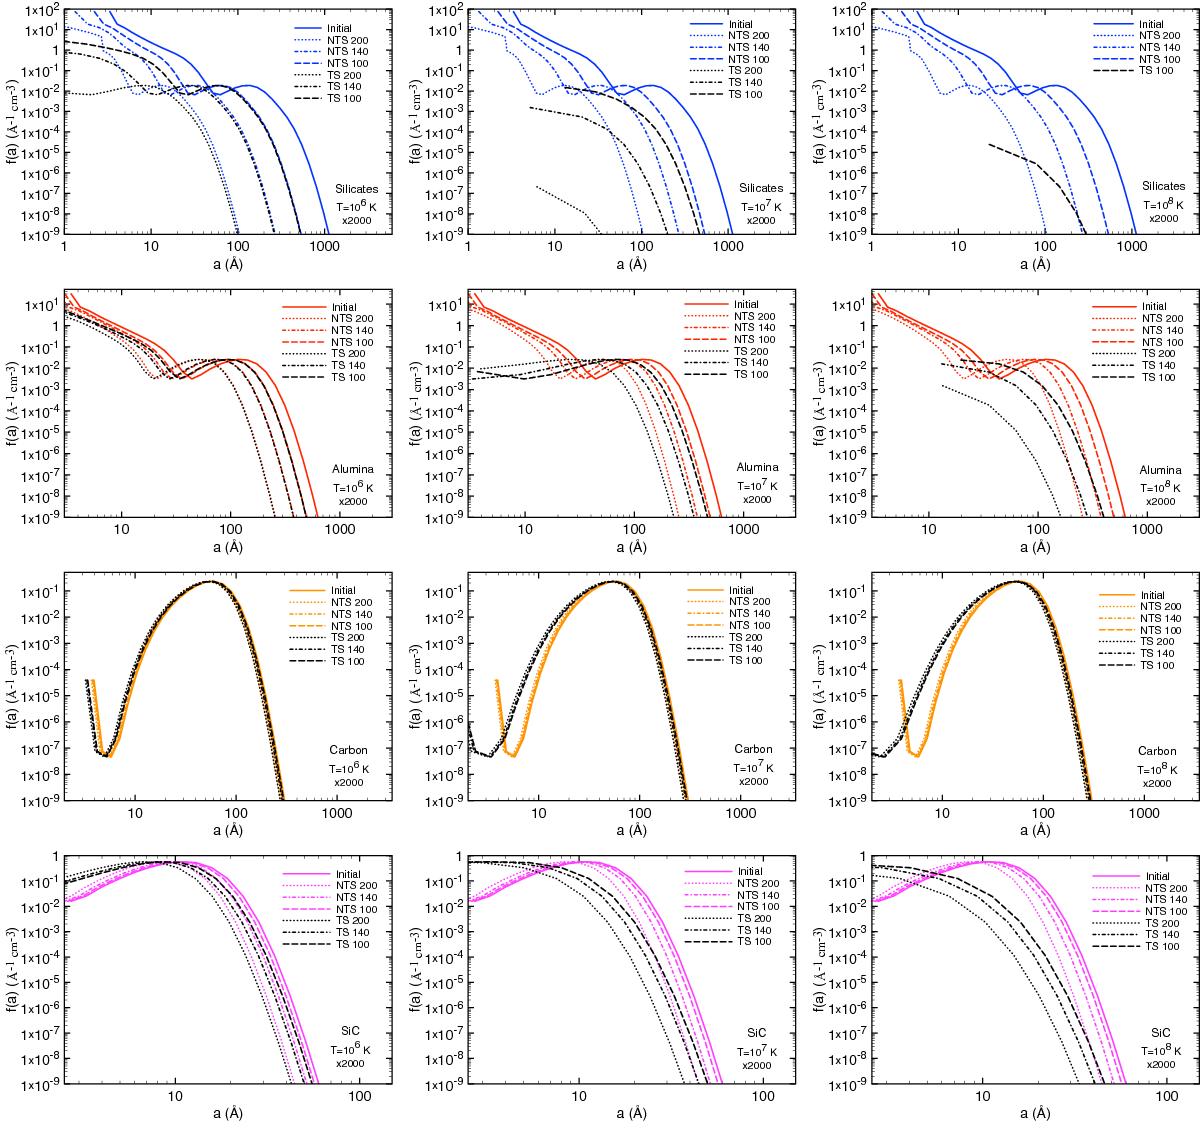
Same as Figs. 7 and 8 for the case of a Type II-P homogeneous ejecta clump (× 2000 case) shocked by the reverse shock. The initial size distributions are plotted with a full line, size distributions after non-thermal sputtering within the clump are plotted with coloured dashed (vs = 100 km s-1), dashed-dotted (vs = 140 km s-1), and dotted lines (vs = 200 km s-1) and after thermal sputtering with black lines for three values of the inter-clump gas temperature (106 K, 107 K and 108 K).
Current usage metrics show cumulative count of Article Views (full-text article views including HTML views, PDF and ePub downloads, according to the available data) and Abstracts Views on Vision4Press platform.
Data correspond to usage on the plateform after 2015. The current usage metrics is available 48-96 hours after online publication and is updated daily on week days.
Initial download of the metrics may take a while.