Fig. 3
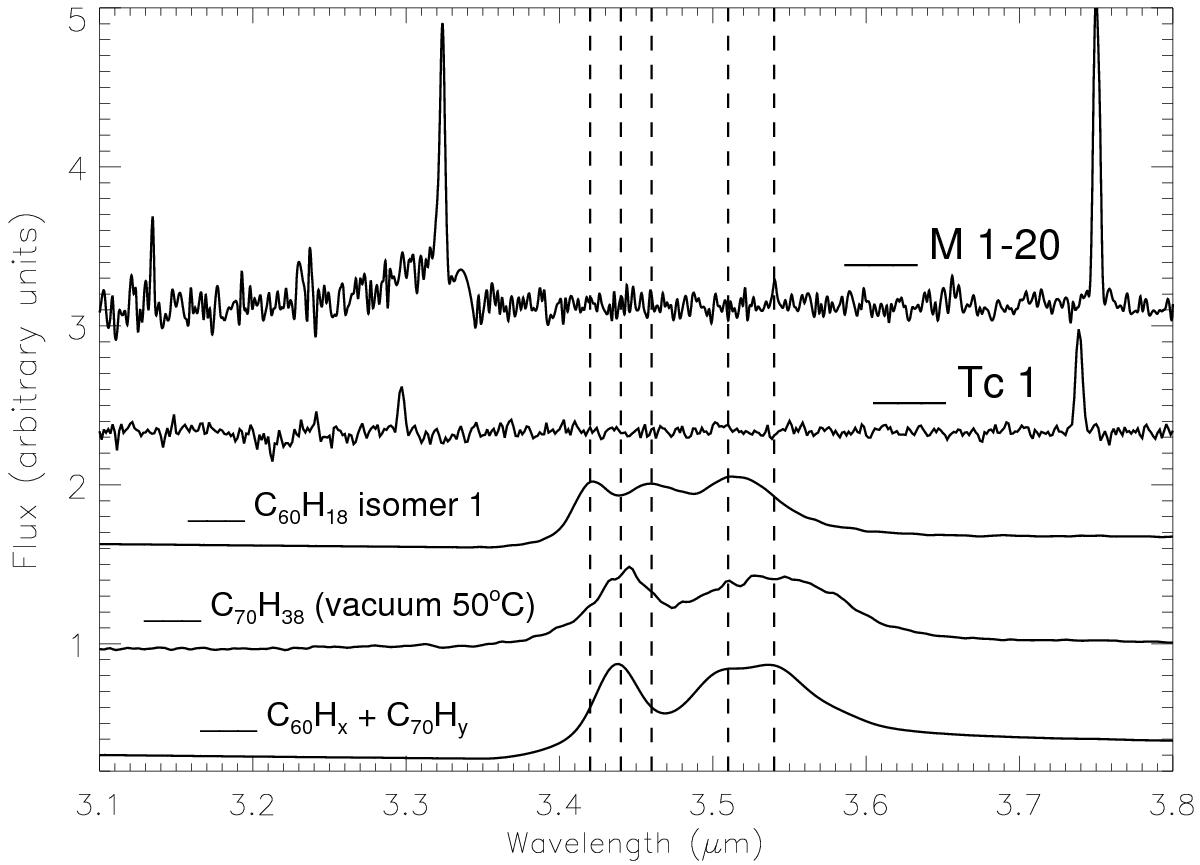
VLT/ISAAC spectra of M 1−20 and Tc 1, in comparison with the laboratory spectra of the fulleranes C60H18, C70H38, and C60Hx+C70Hy in the 3.1−3.8 μm range. Note that the C60H18 fullerane bands at 3.42, 3.46, and 3.51 μm and the C70H38 fullerane bands at 3.44 and 3.54 μm are marked with dashed lines. The C60Hx+C70Hy fullerane bands are those at 3.44, 3.51, and 3.54 μm.
Current usage metrics show cumulative count of Article Views (full-text article views including HTML views, PDF and ePub downloads, according to the available data) and Abstracts Views on Vision4Press platform.
Data correspond to usage on the plateform after 2015. The current usage metrics is available 48-96 hours after online publication and is updated daily on week days.
Initial download of the metrics may take a while.