Free Access
Fig. 6
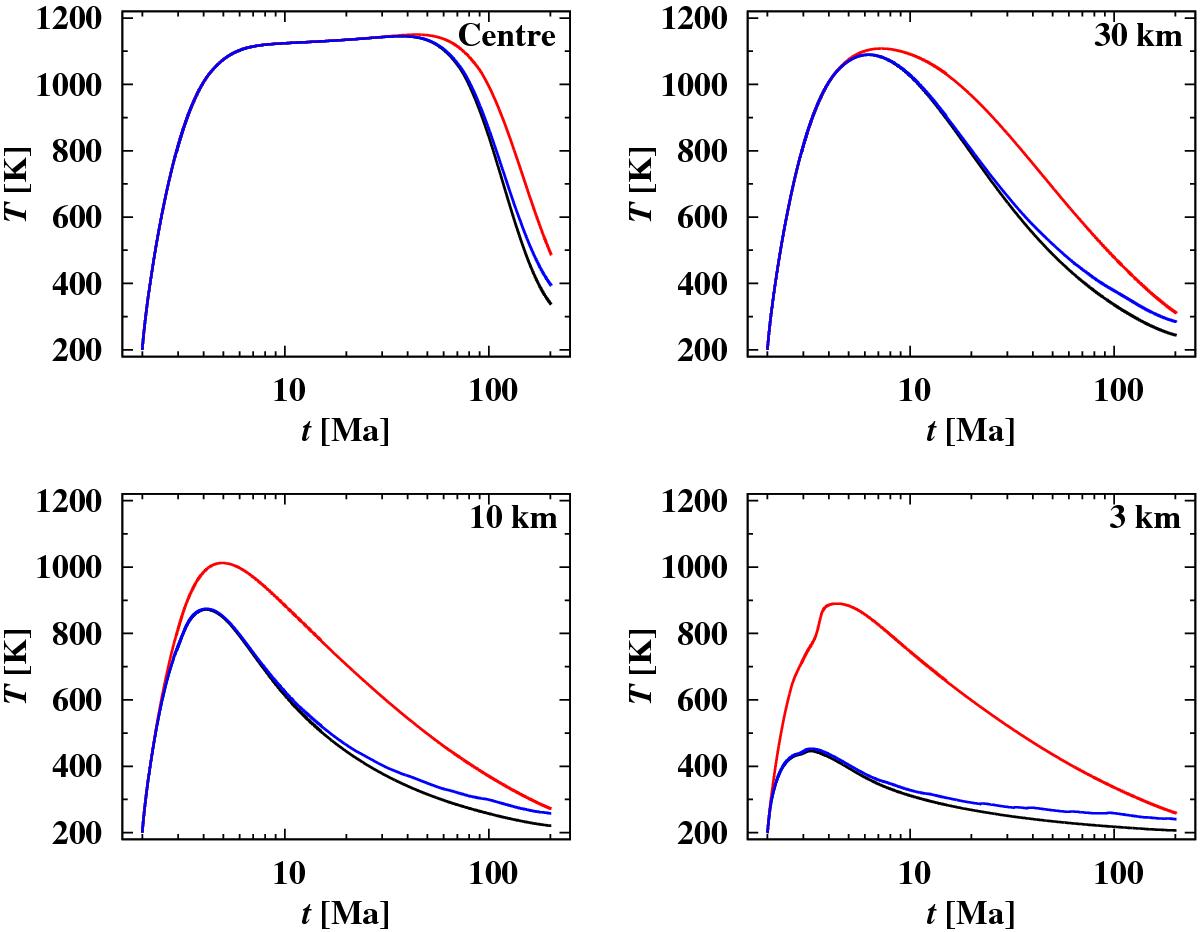
Comparison of the temperature evolution of a parent body at depths of 3, 10, and 30 km and at the centre of the body with different assumptions with respect to the porosity of the surface layers. Red lines: model Y. Black lines: model G. Blue lines: model with growing outer regolith layer.
Current usage metrics show cumulative count of Article Views (full-text article views including HTML views, PDF and ePub downloads, according to the available data) and Abstracts Views on Vision4Press platform.
Data correspond to usage on the plateform after 2015. The current usage metrics is available 48-96 hours after online publication and is updated daily on week days.
Initial download of the metrics may take a while.