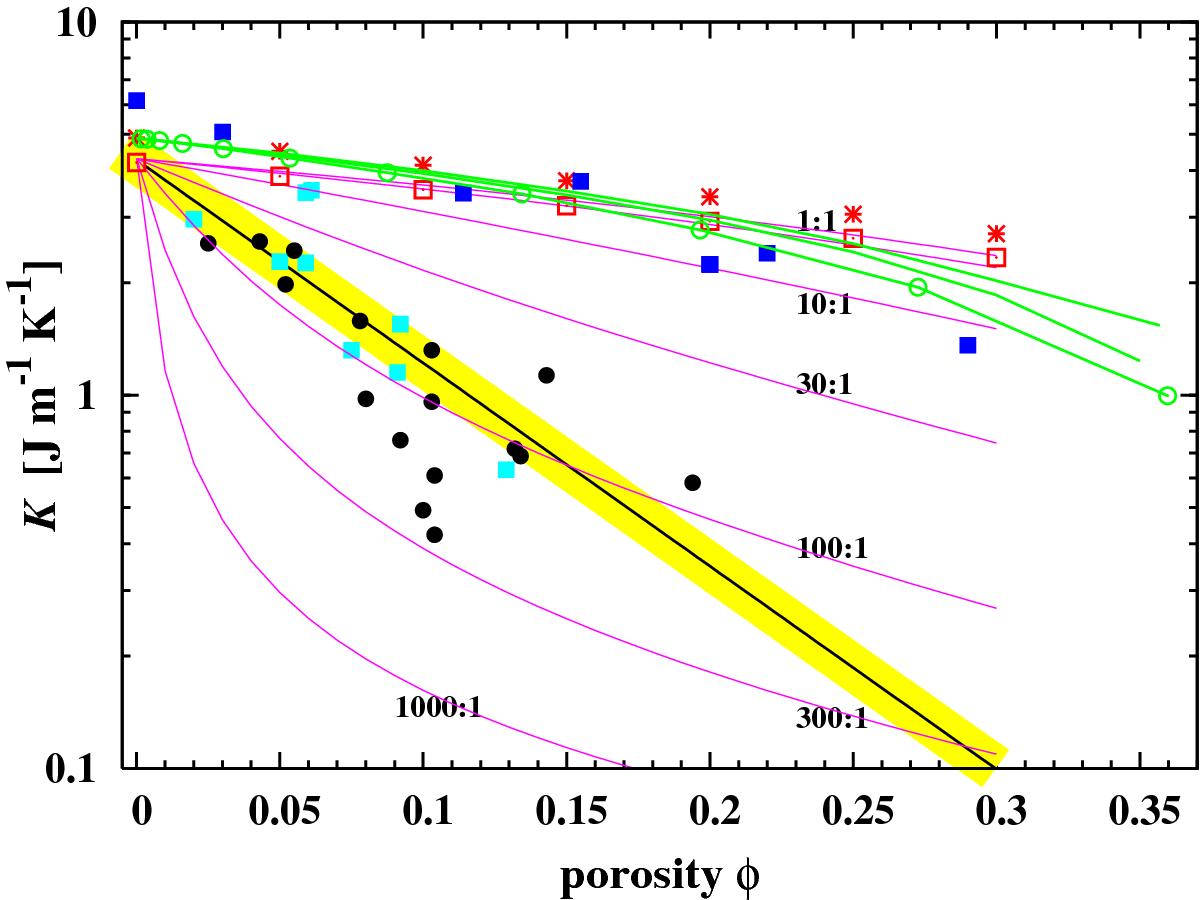
Fig. 4
Comparison of calculated heat conductivities of porous chondritic material and measured data given in Yomogida & Matsui (1983) with some additional data from Opeil et al. (2012). Lower solid black line: least-squares fit to data (filled cyan squares: H chondrites; filled circles: L chondrites). Red symbols: results of a numerical simulation including some pore space corresponding to porosity φ (crosses: H chondrite; open squares: L chondrite material). The blue filled squares are measured values for sandstone (Desai et al. 1974). Solid green lines: Simulated sintered granular material. Solid green line with circles: Sintered granular material of glass beads described in Sect. 4.2. The lilac lines are for crack-like voids simulated by the Bruggeman mixing rule with rotational ellipsoids of the indicated axis ratio as inclusions. Upper solid black line: Approximation (19) for sintered material.
Current usage metrics show cumulative count of Article Views (full-text article views including HTML views, PDF and ePub downloads, according to the available data) and Abstracts Views on Vision4Press platform.
Data correspond to usage on the plateform after 2015. The current usage metrics is available 48-96 hours after online publication and is updated daily on week days.
Initial download of the metrics may take a while.