Fig. C.1
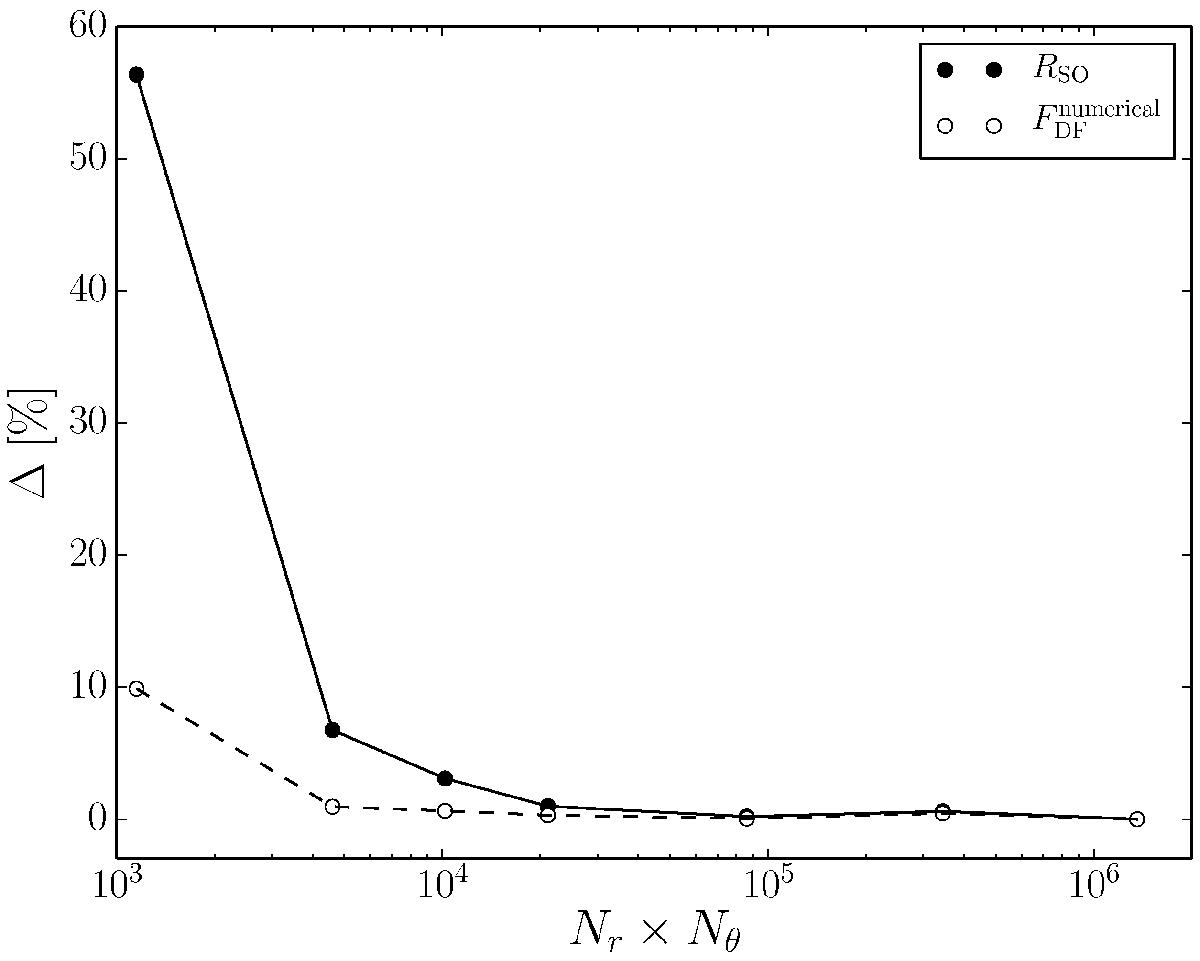
Convergence test of the numerical set-up. Values on the horizontal axis denote the total number of grid cells Nr × Nθ. The vertical axis shows the relative deviation of the resulting stand-off distance RSO (solid circles) and the dynamical friction ![]() (dashed circles) from its corresponding value of the highest resolution run.
(dashed circles) from its corresponding value of the highest resolution run.
Current usage metrics show cumulative count of Article Views (full-text article views including HTML views, PDF and ePub downloads, according to the available data) and Abstracts Views on Vision4Press platform.
Data correspond to usage on the plateform after 2015. The current usage metrics is available 48-96 hours after online publication and is updated daily on week days.
Initial download of the metrics may take a while.