Fig. 2
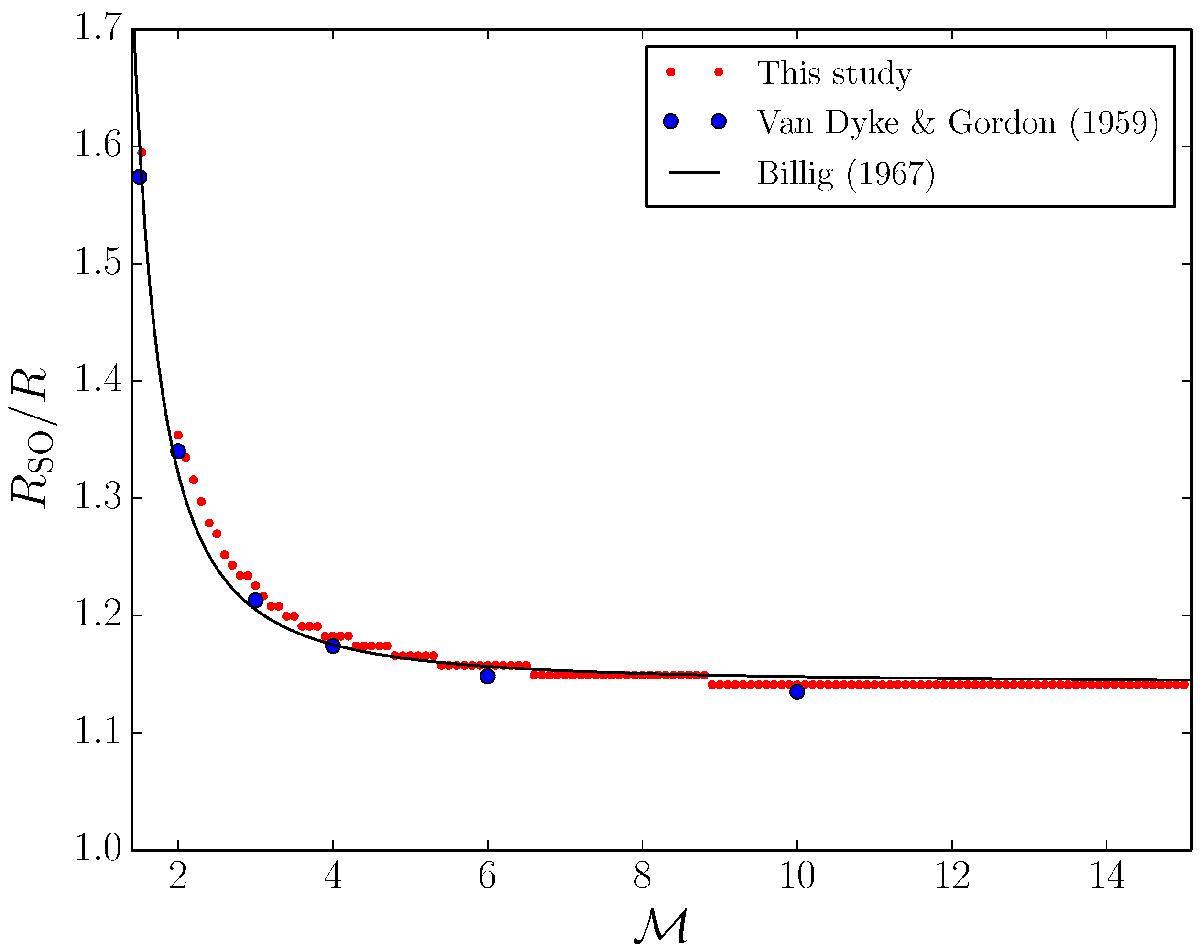
Quantitative comparison of the shock’s stand-off distance as function of Mach number. The solid black line denotes the relationship derived from laboratory experiments as given in the main text. Small red dots represent results from numerical experiments for the same set-up. Blue dots denote early numerical results by van Dyke & Gordon (1959).
Current usage metrics show cumulative count of Article Views (full-text article views including HTML views, PDF and ePub downloads, according to the available data) and Abstracts Views on Vision4Press platform.
Data correspond to usage on the plateform after 2015. The current usage metrics is available 48-96 hours after online publication and is updated daily on week days.
Initial download of the metrics may take a while.