Fig. A.2
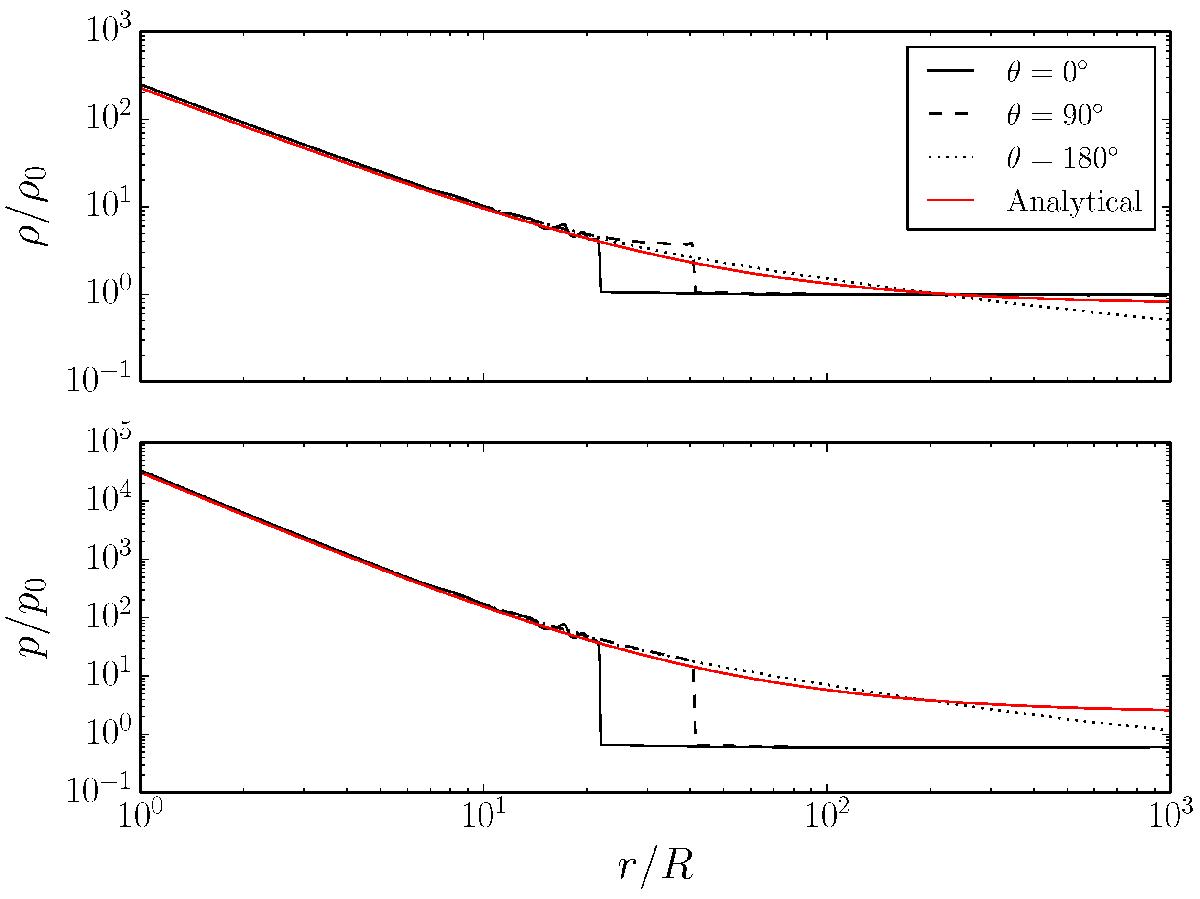
Stratification of gas density (upper panel) and pressure (bottom panel) around the moving object. As in the previous figure, values in front of the moving object (θ = 0), perpendicular to its velocity (θ = 90), and behind the object (θ = 180) are displayed. The additional red lines denote the analytical estimates obtained from Eqs. (A.7)and (A.2), respectively. In the formula of the estimate, a value for the stand-off distance of xSO = 0.533 was used, in accordance with the final quasi-stationary state of the numerical experiment.
Current usage metrics show cumulative count of Article Views (full-text article views including HTML views, PDF and ePub downloads, according to the available data) and Abstracts Views on Vision4Press platform.
Data correspond to usage on the plateform after 2015. The current usage metrics is available 48-96 hours after online publication and is updated daily on week days.
Initial download of the metrics may take a while.