Fig. 15
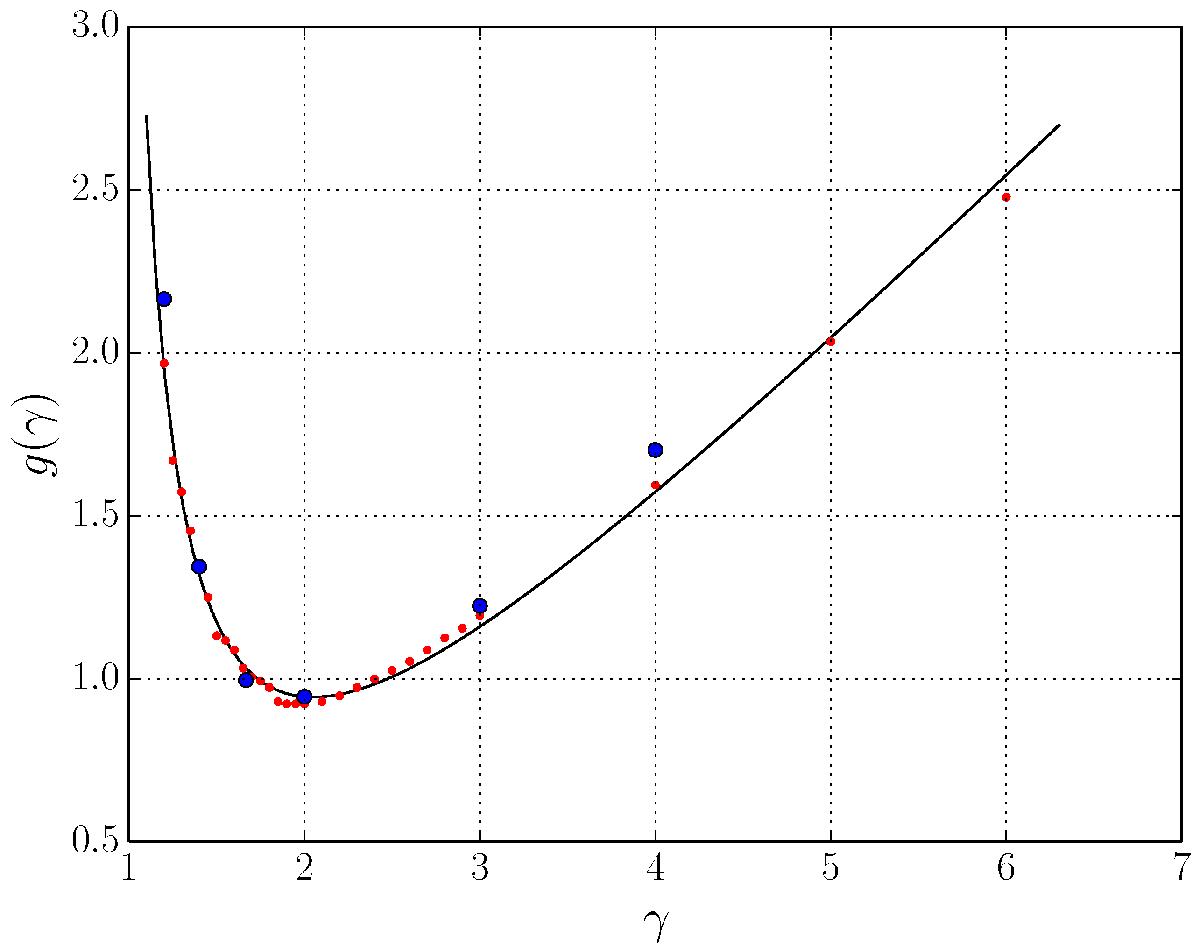
Comparison of the semi-analytical approximation of the function g(γ), see Eq. (35), shown as a black line with numerically obtained values. Small red dots denote the simulation series “G” with varying adiabatic index; each red dot represents a single simulation. Larger blue dots denote values derived by fitting the scaling of the stand-off distance with the non-linearity parameter for a variety of different simulation series shown in the top panel of Fig. 13; each blue dot represents such a fit value to a full simulation series. See main text for details of the derivation.
Current usage metrics show cumulative count of Article Views (full-text article views including HTML views, PDF and ePub downloads, according to the available data) and Abstracts Views on Vision4Press platform.
Data correspond to usage on the plateform after 2015. The current usage metrics is available 48-96 hours after online publication and is updated daily on week days.
Initial download of the metrics may take a while.