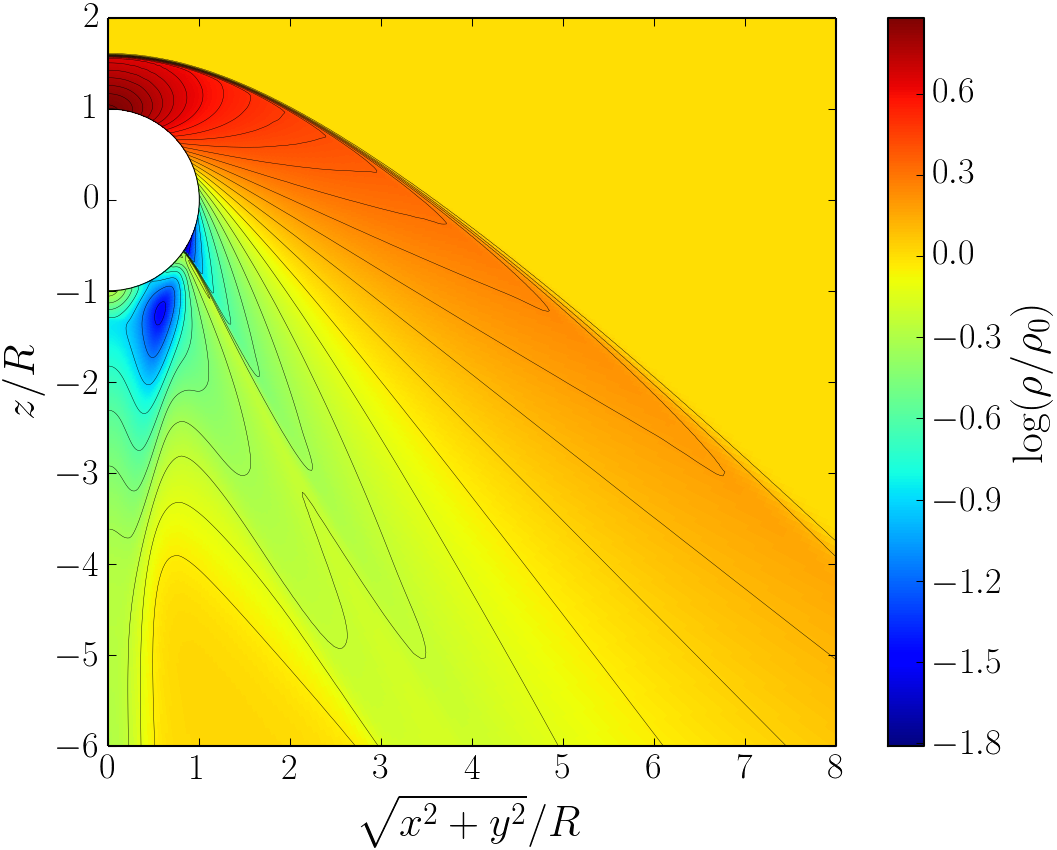
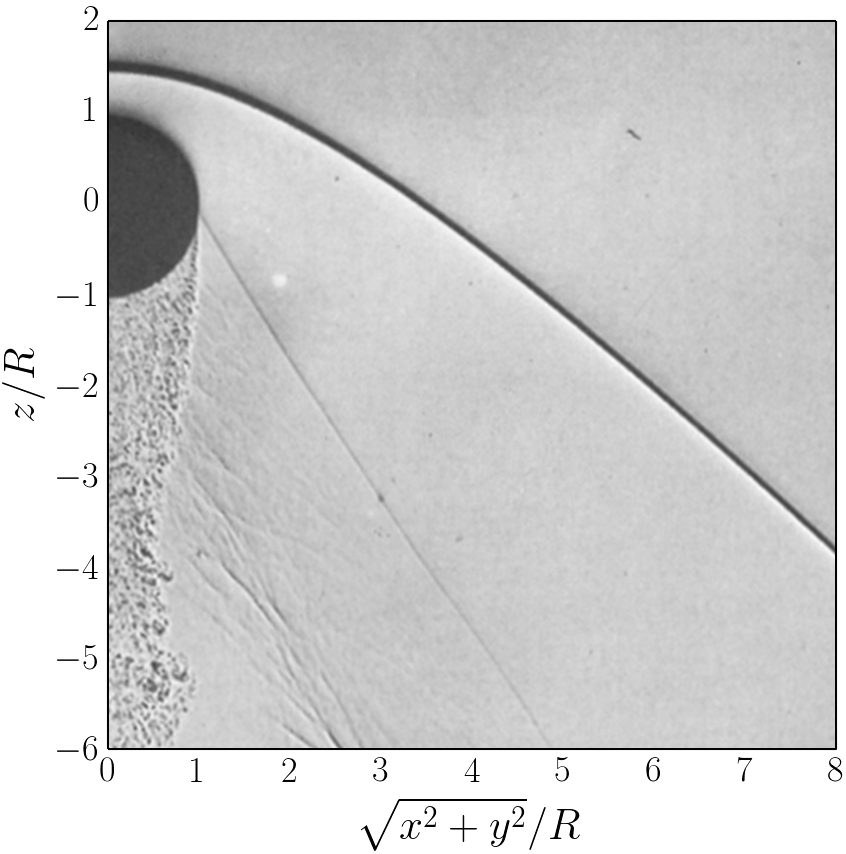
Fig. 1
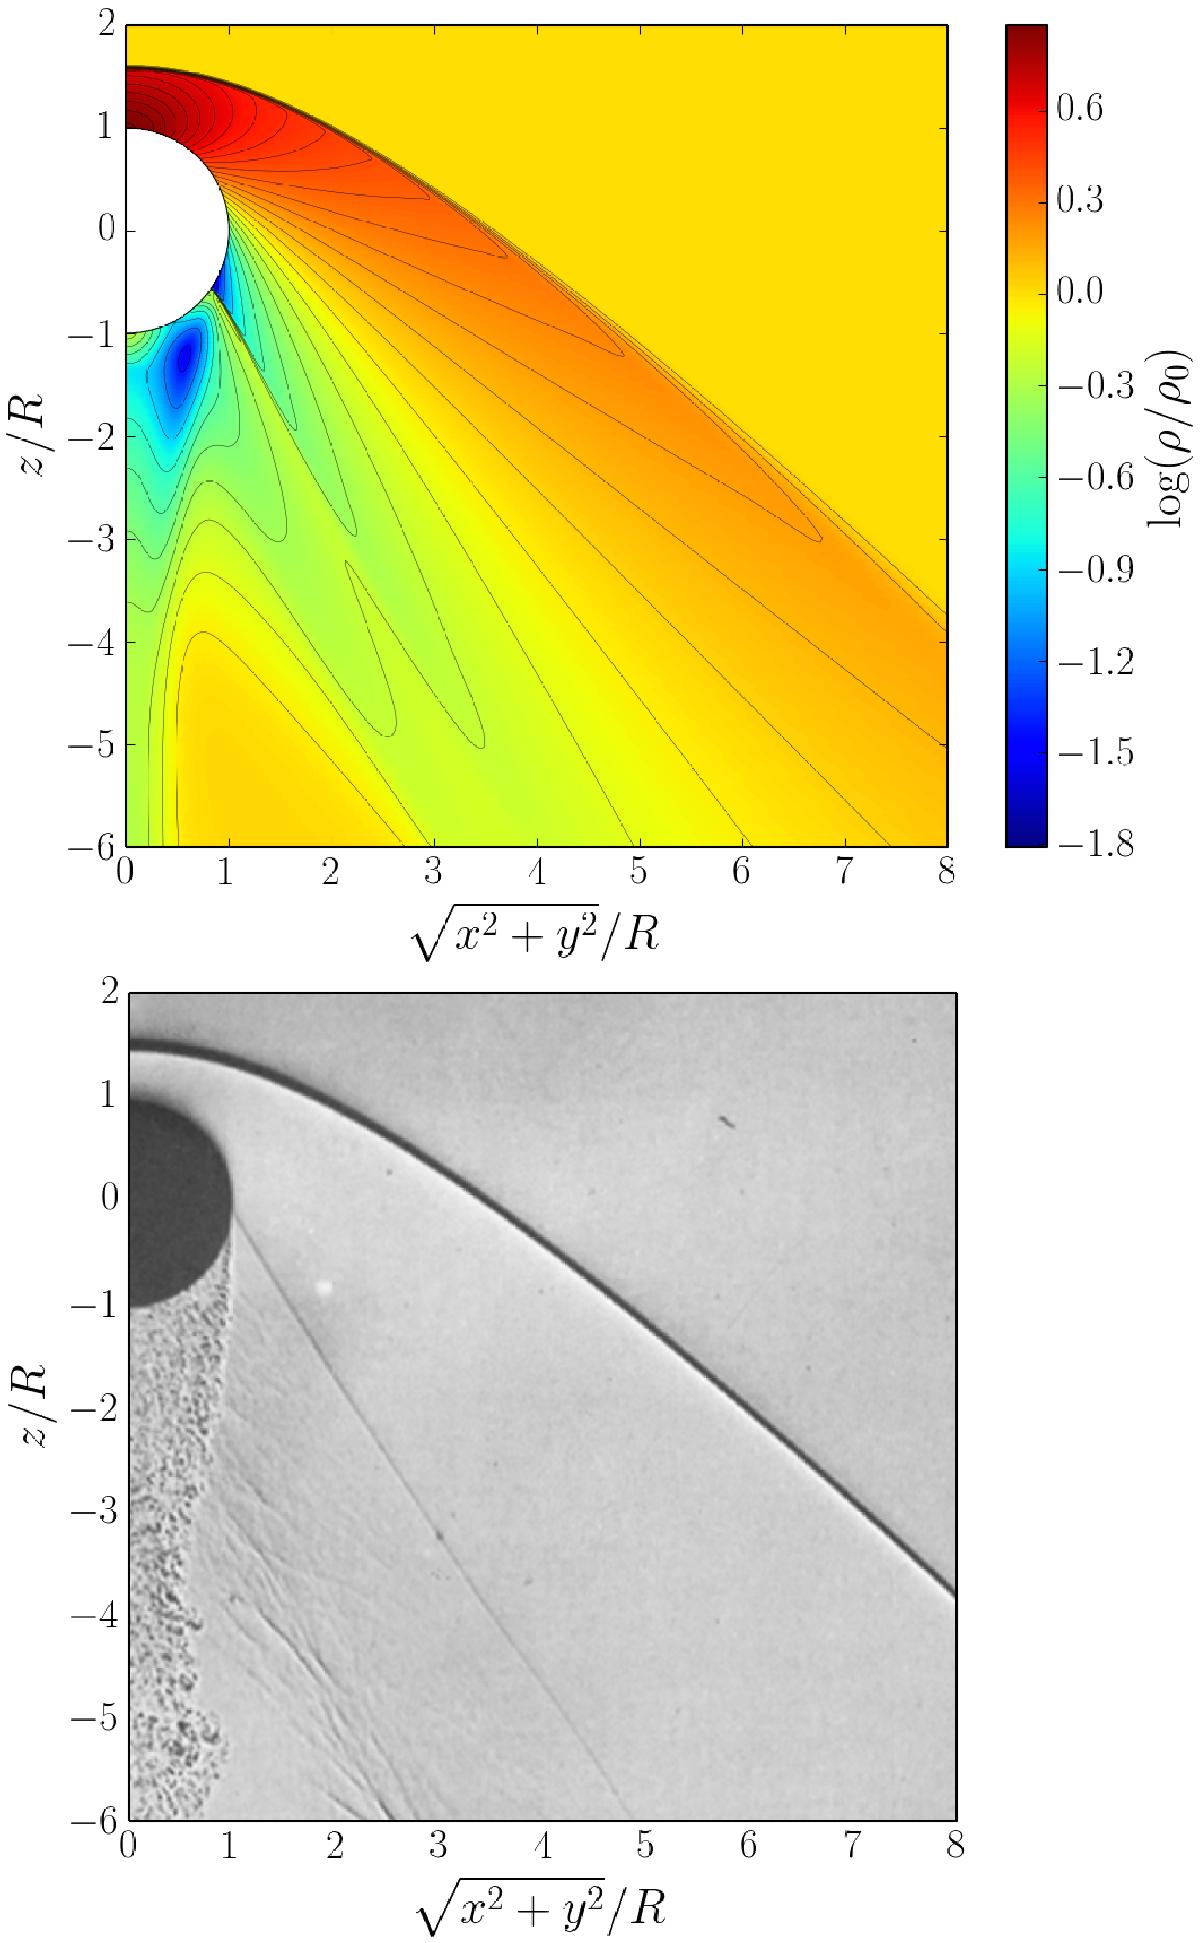
Visualization of a comparison simulation result of a sphere embedded in air flow (γ = 1.4) at a Mach number ℳ = 1.53. The homogeneous gas arrives from the top and flows in the negative z-direction. Shown is the density distribution for the final equilibrium state in the central part of the computational domain around the sphere. Upper panel: numerical results, black lines denote iso-density contours. Bottom panel: laboratory data from van Dyke (1982, Fig. 266).

Current usage metrics show cumulative count of Article Views (full-text article views including HTML views, PDF and ePub downloads, according to the available data) and Abstracts Views on Vision4Press platform.
Data correspond to usage on the plateform after 2015. The current usage metrics is available 48-96 hours after online publication and is updated daily on week days.
Initial download of the metrics may take a while.