Fig. 8
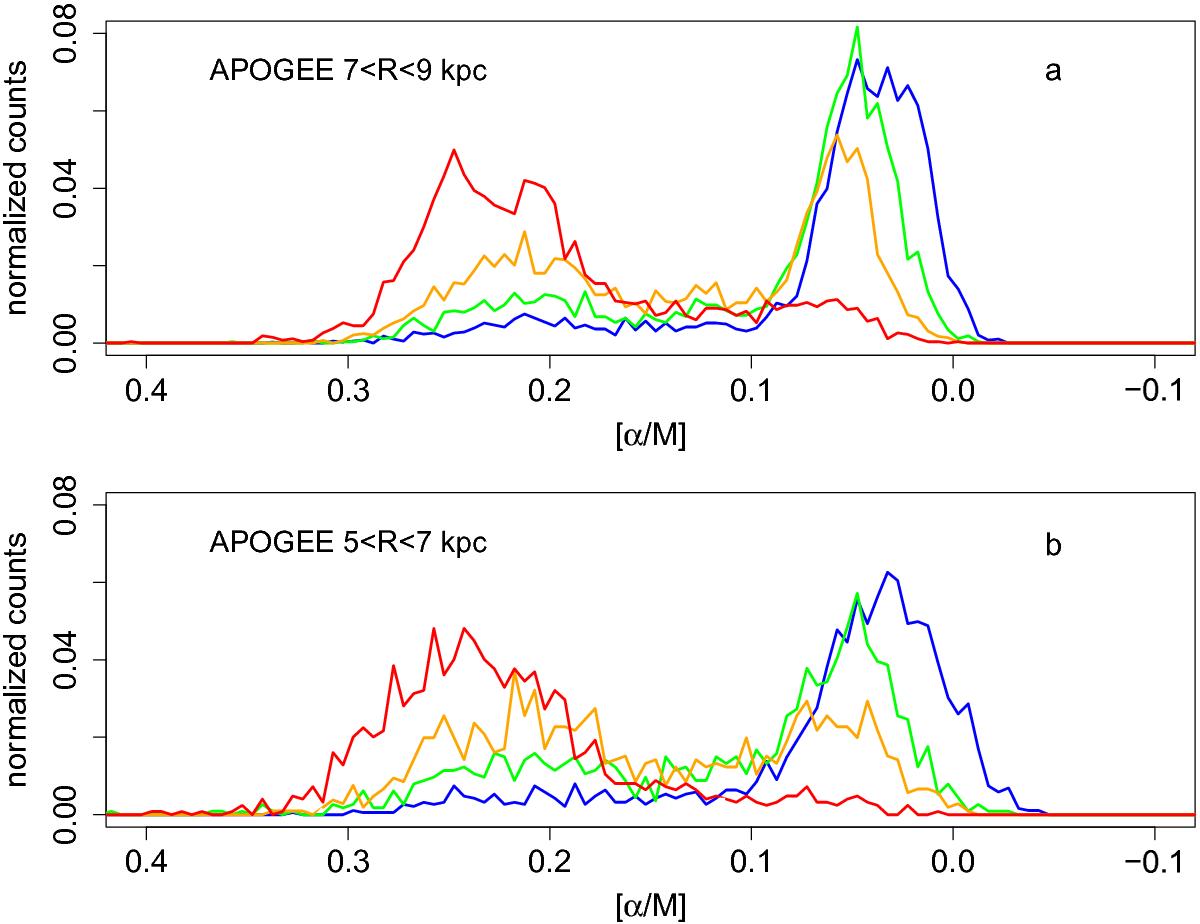
Normalized [α/M] counts from APOGEE in two different distance bins to the Galactic centre (the distances are indicated in each plot). The different curves correspond to different z intervals above the Galactic plane. Red represents stars above 1 kpc, orange those between 1 and 0.5 kpc, green stars between 0.5 and 0.25 kpc, and blue stars at 0.25 kpc relative to the Galactic mid-plane. At no height above the Galactic plane are the star counts dominated by stars with [α/M] between 0.08 and 0.18 dex.
Current usage metrics show cumulative count of Article Views (full-text article views including HTML views, PDF and ePub downloads, according to the available data) and Abstracts Views on Vision4Press platform.
Data correspond to usage on the plateform after 2015. The current usage metrics is available 48-96 hours after online publication and is updated daily on week days.
Initial download of the metrics may take a while.