Fig. 6
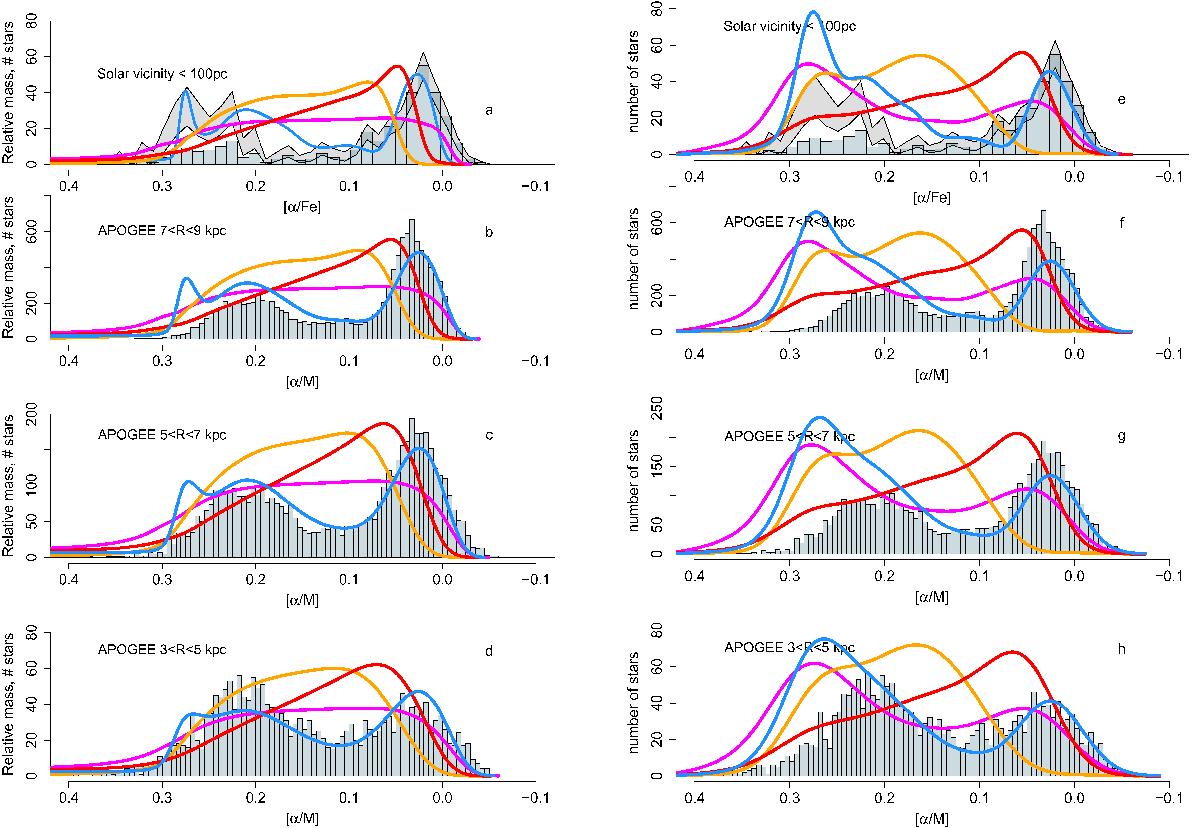
a) Comparisons between observed and modelled mass (abcd) and star number (efgh) distributions as a function of [α/Fe]. Plots a) and e) show our calibration sample (solar vicinity) and panels (bcd) and (fgh) the APOGEE survey. The solar vicinity observed distribution in panels a) and e) has been corrected to account for the lower sampling of old populations in the Galactic plane. From top to bottom, models have been convolved with increasing dispersion (0.01, 0.015, 0.020, and 0.025 dex) to account for the difference in data quality. For comparison with APOGEE data, models have been shifted by +0.025 dex to allow for an offset in the α-element abundance scale between our calibration sample and APOGEE.
Current usage metrics show cumulative count of Article Views (full-text article views including HTML views, PDF and ePub downloads, according to the available data) and Abstracts Views on Vision4Press platform.
Data correspond to usage on the plateform after 2015. The current usage metrics is available 48-96 hours after online publication and is updated daily on week days.
Initial download of the metrics may take a while.