Fig. 4
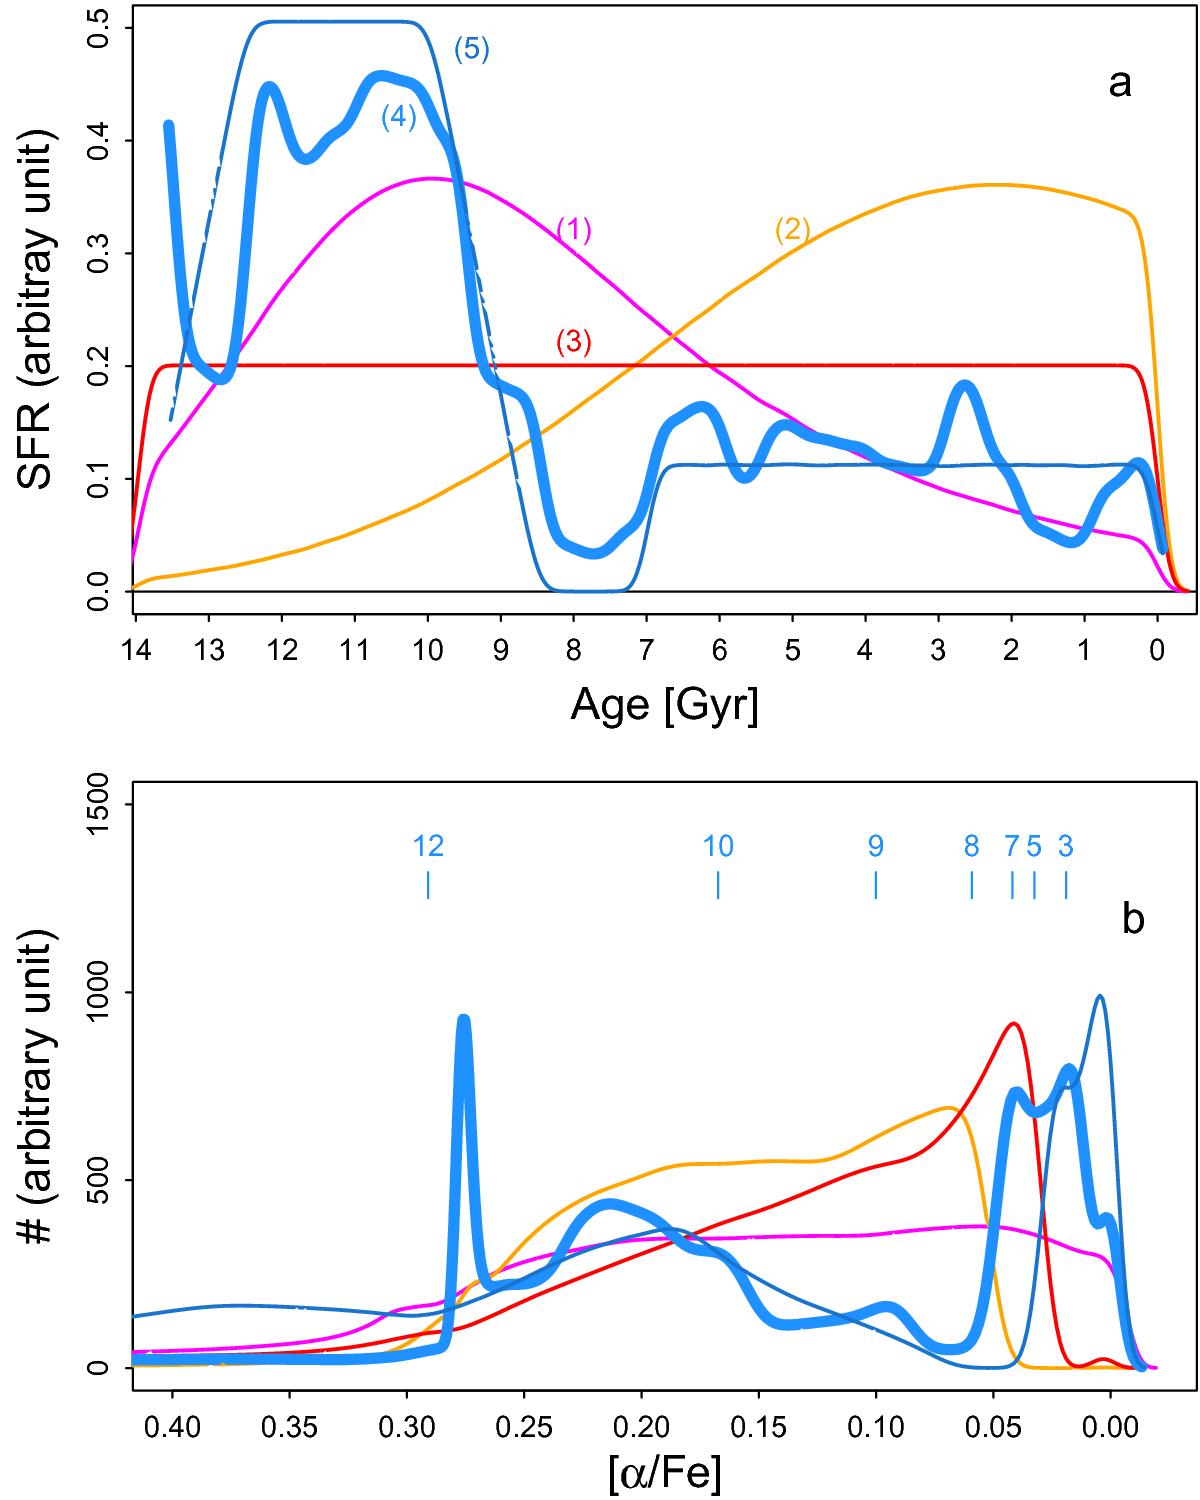
a) Broad range of SFHs designed to cover decreasing, increasing, and constant star-formation rates with time (labelled 1, 2, 3), and the SFH from Snaith et al. (2014, 2015), with a dip between 8.5 and 7 Gyr (thick blue curve labelled 4). SFH 5 is similar to 4 with noise removed (thin dark blue curve). b) The corresponding stellar densities as a function of [α/Fe]. SFHs like 1, 2, and 3 do not generate a dip in the [α/Fe] distribution. Only an SFH like 4 (or 5) with a drop and cessation in star formation in the specific time interval between ~10 to 7 Gyr can generate a distribution with a significant dip (blue curve). The short blue vertical lines indicate the time variation in Gyr for model 4 (thick blue curve). The peak at [α/ Fe] ~ 0.28 dex is due to the flattening of the variation of [α/Fe] visible in Fig. 1, which is not at all significant compared to the data used to generate the SFH (Snaith et al. 2014, 2015).
Current usage metrics show cumulative count of Article Views (full-text article views including HTML views, PDF and ePub downloads, according to the available data) and Abstracts Views on Vision4Press platform.
Data correspond to usage on the plateform after 2015. The current usage metrics is available 48-96 hours after online publication and is updated daily on week days.
Initial download of the metrics may take a while.