Fig. 3
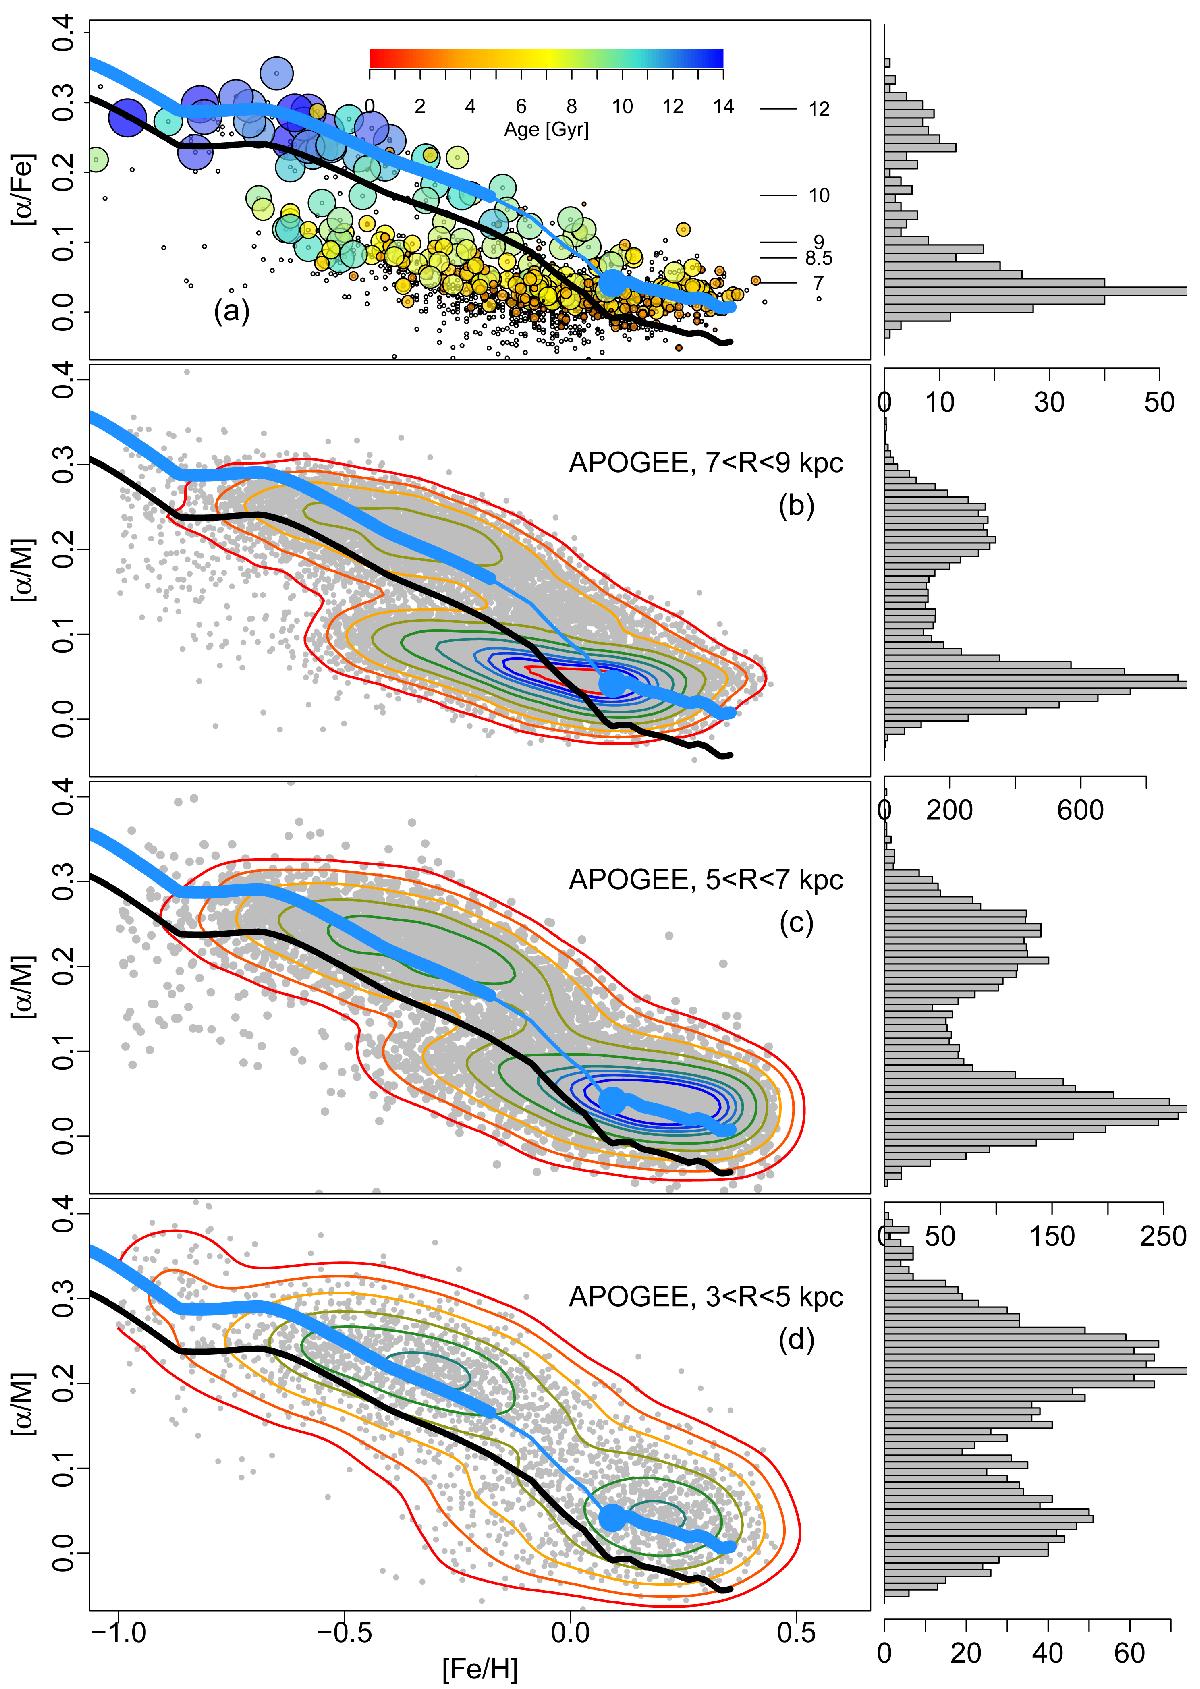
a) Abundance distributions for stars in the solar vicinity from very high resolution spectroscopic data and b)–d) data from APOGEE. The inner-disk sequence (above the black line) is composed of thick-disk and metal-rich thin-disk stars and dominates the inner-disk stellar populations, as illustrated in c) and d). The blue thick curve represents the track of our chemical evolution model, with the dot indicating the beginning of the thin-disk era at 7 Gyr. The thinner blue segment indicates the quenching phase from 10 to 7 Gyr. The black line is defined as the model −0.05 dex in [α/Fe]. We emphasize that the model (blue line) represents the evolution of the inner-disk sequence alone (stars above the black line). The outer-disk sequence (below the black line) represents a different evolution and requires a different model (see Snaith et al. 2015). The histograms count the number of stars above the black line. In a), grey points are all the stars in the solar vicinity sample, while coloured circles are a subsample for stars with age. The size and colour of the symbols code the age of the stars. The tick marks indicate the age of the model along the track. The histogram includes all stars above the black line (whether they have an age determination or not).
Current usage metrics show cumulative count of Article Views (full-text article views including HTML views, PDF and ePub downloads, according to the available data) and Abstracts Views on Vision4Press platform.
Data correspond to usage on the plateform after 2015. The current usage metrics is available 48-96 hours after online publication and is updated daily on week days.
Initial download of the metrics may take a while.