Fig. 2
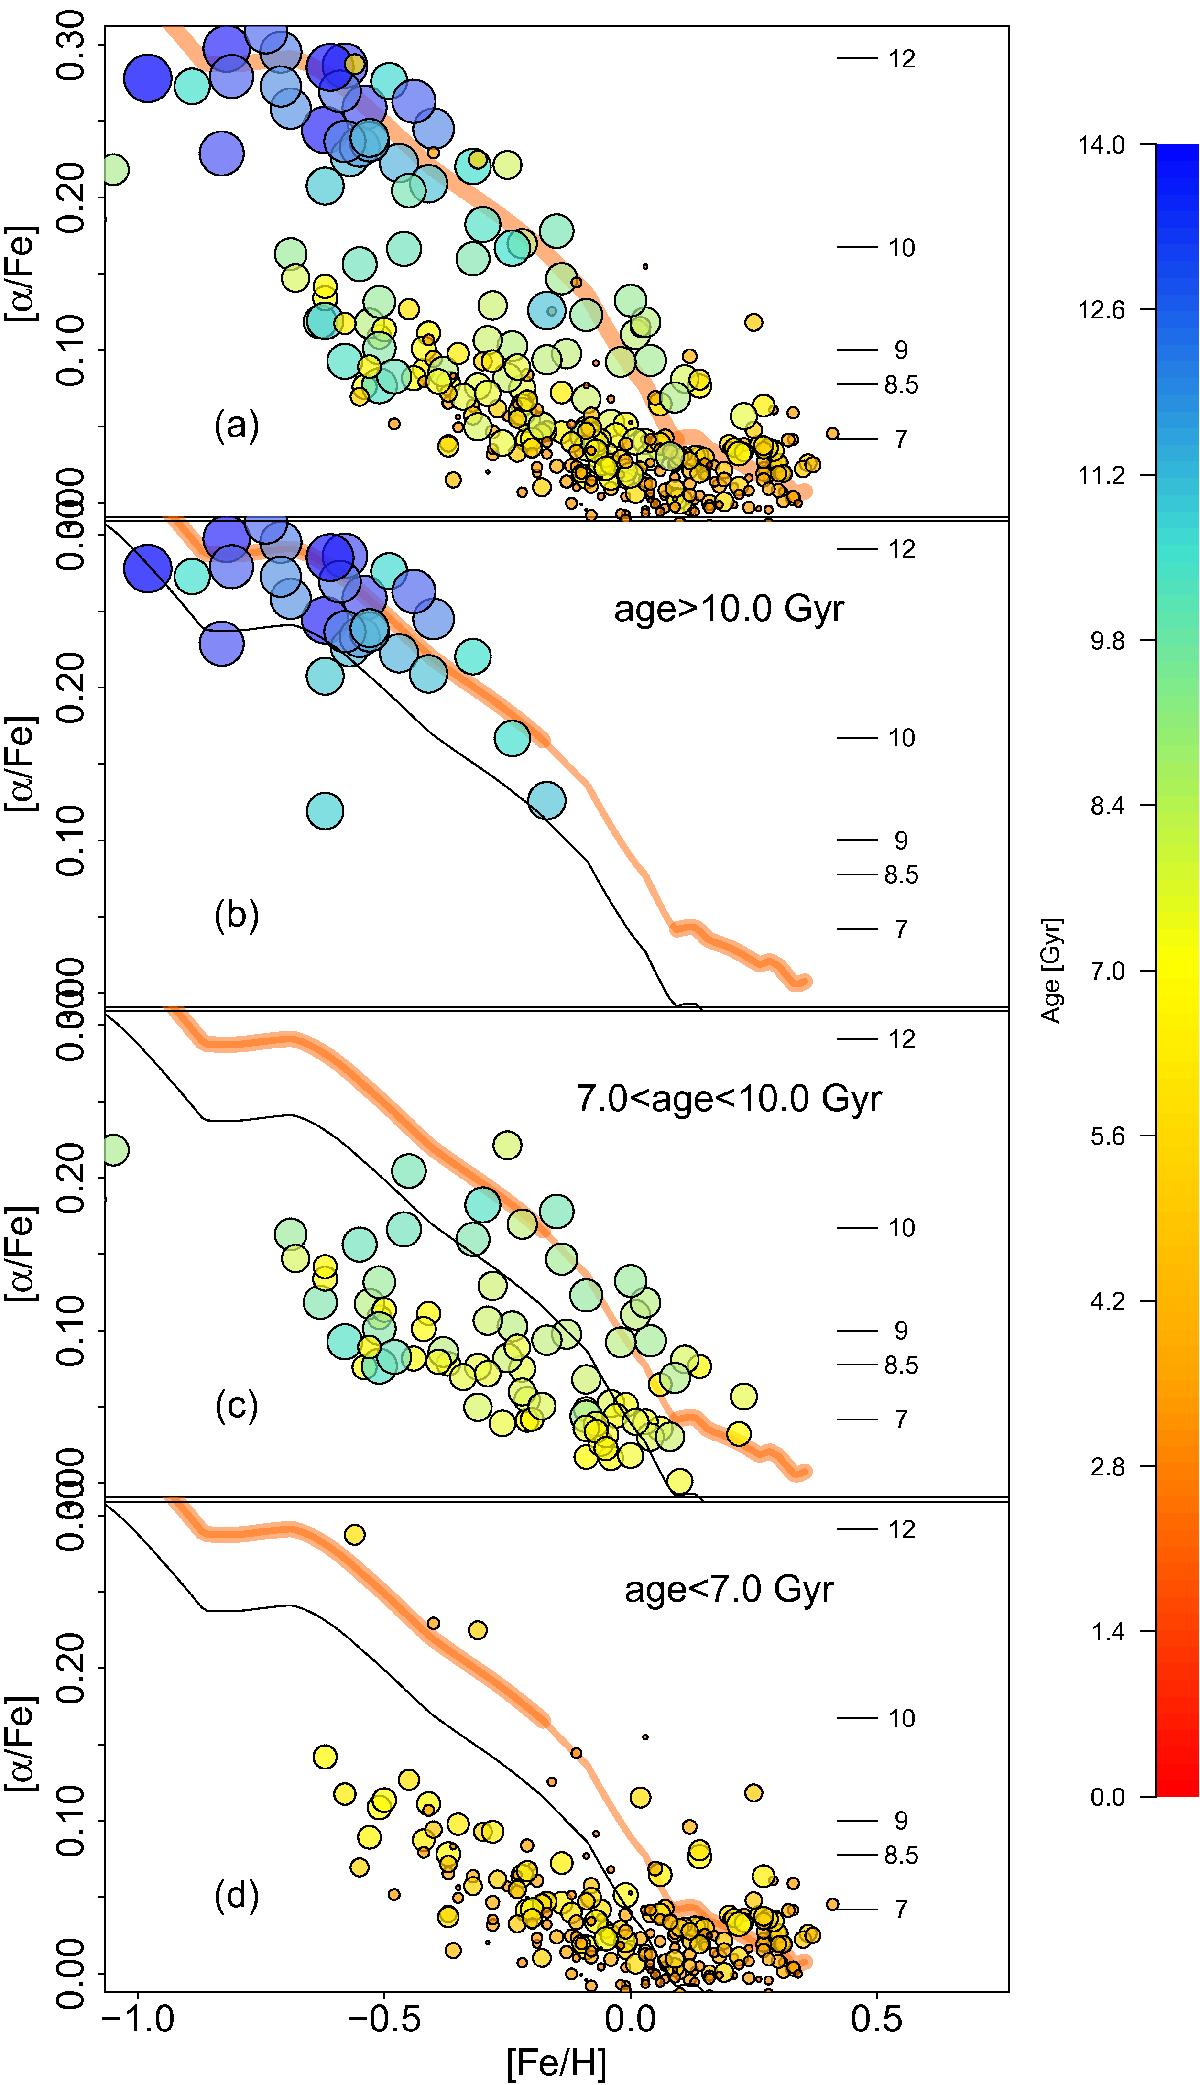
[α/Fe]-[Fe/H] distribution at the solar vicinity for the sample of Adibekyan et al. (2012) with ages from Haywood et al. (2013). The colours (indicated in the legend) and size of the symbols indicate the age of the stars (larger circles imply older ages). The orange line represents the model of Snaith et al. (2015), which has the SFH of Fig. 1. The thinner segment of the line corresponds to the lull in the SFH of Fig. 1, between 10 and 7 Gyr ago. The thin black curve is the same model shifted down by −0.05 dex and is used in Sect. 3 to select inner-disk stars from the APOGEE survey. The stars below and to the left of this line are either accreted stars according to Nissen & Schuster (2010; for those objects which have [Fe/H] <−0.7 dex), or metal-poor thin-disk stars. A vertical scale within each plot indicates ages along the model from 7 to 12 Gyr.
Current usage metrics show cumulative count of Article Views (full-text article views including HTML views, PDF and ePub downloads, according to the available data) and Abstracts Views on Vision4Press platform.
Data correspond to usage on the plateform after 2015. The current usage metrics is available 48-96 hours after online publication and is updated daily on week days.
Initial download of the metrics may take a while.