Fig. 8
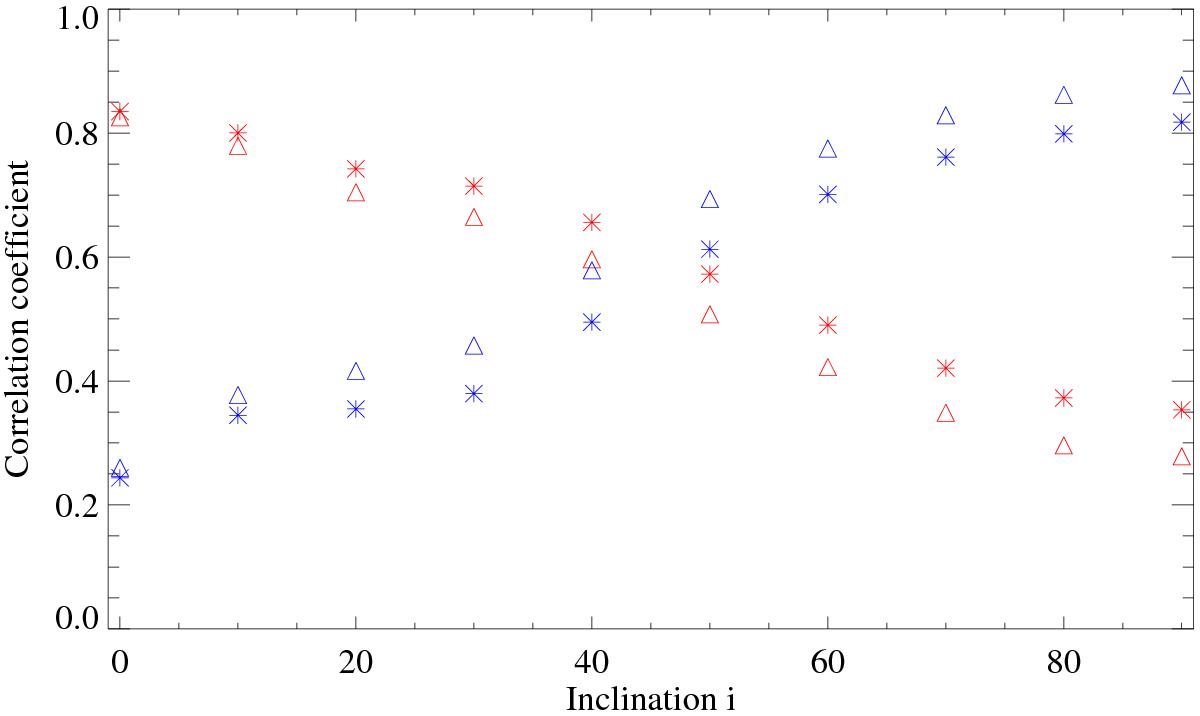
Dependence of the Pearson correlation coefficients between spot and total light curves (ρtot,spot, blue symbols) and between facular and total light curves (ρtot,fac, red symbols) on inclination. The correlation coefficients are calculated for solar brightness variations in 2002 as they would be observed in the Kepler passband (asterisks) and in the Strömgren (b + y)/2 photometry (triangles).
Current usage metrics show cumulative count of Article Views (full-text article views including HTML views, PDF and ePub downloads, according to the available data) and Abstracts Views on Vision4Press platform.
Data correspond to usage on the plateform after 2015. The current usage metrics is available 48-96 hours after online publication and is updated daily on week days.
Initial download of the metrics may take a while.