Fig. 7
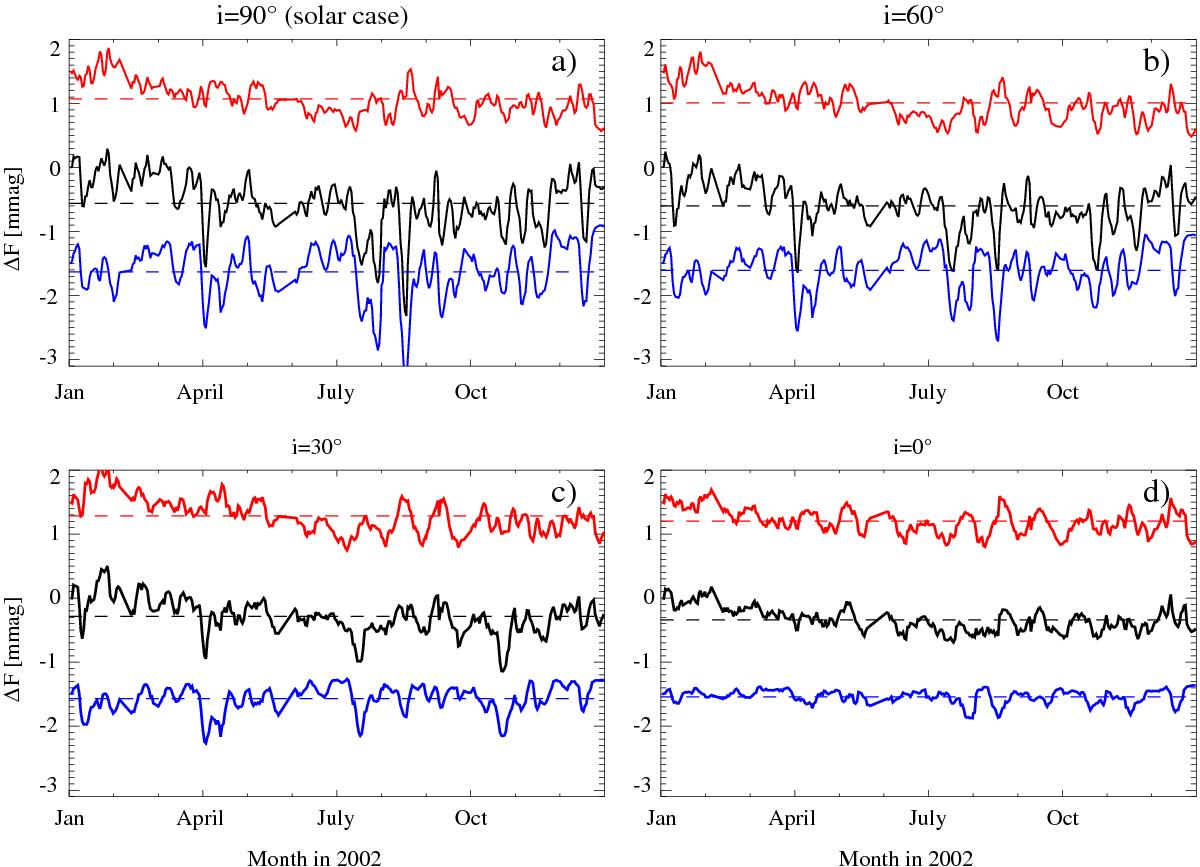
Solar total (black curves), facular (red), and spot (blue) light curves as they would appear to Kepler. The light curves are plotted for four values of solar inclination: 90° (panel a)), 60° (panel b)), 30° (panel c)), and 0° (panel d)). The mean levels of all plotted light curves (indicated by the dashed lines) have been offset relative to each other for clarity, so that only the variations of the brightness, but not the offsets, have a physical meaning.
Current usage metrics show cumulative count of Article Views (full-text article views including HTML views, PDF and ePub downloads, according to the available data) and Abstracts Views on Vision4Press platform.
Data correspond to usage on the plateform after 2015. The current usage metrics is available 48-96 hours after online publication and is updated daily on week days.
Initial download of the metrics may take a while.