Fig. 5
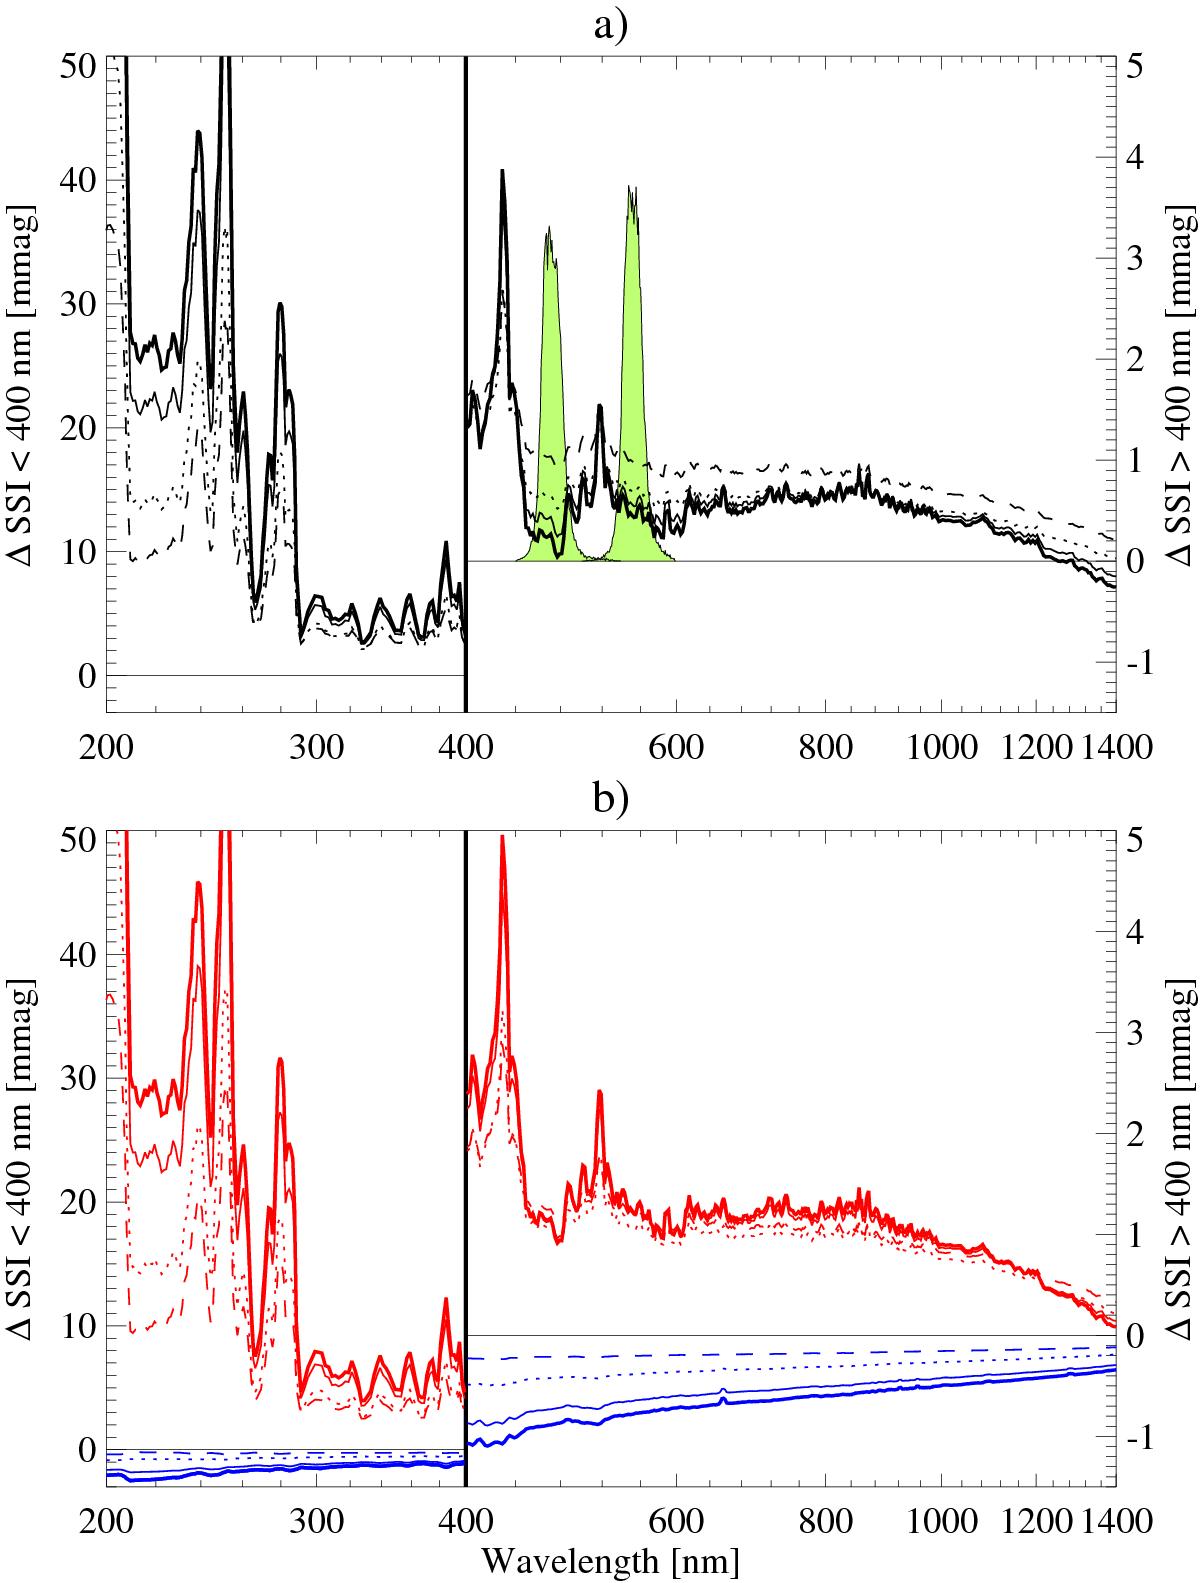
Amplitude of the 11-year solar brightness variability (black curves in panel a)) and its facular and spot components (red and blue curves in panel b), respectively) expressed in mmag. As in Fig. 4 the green shaded contours indicate the transmission curves of the Strömgren filters b and y. The amplitude values are plotted for four values of solar inclination: 90° (thick solid), 60° (thin solid), 30° (dotted), and 0° (dashed).
Current usage metrics show cumulative count of Article Views (full-text article views including HTML views, PDF and ePub downloads, according to the available data) and Abstracts Views on Vision4Press platform.
Data correspond to usage on the plateform after 2015. The current usage metrics is available 48-96 hours after online publication and is updated daily on week days.
Initial download of the metrics may take a while.