Fig. 4
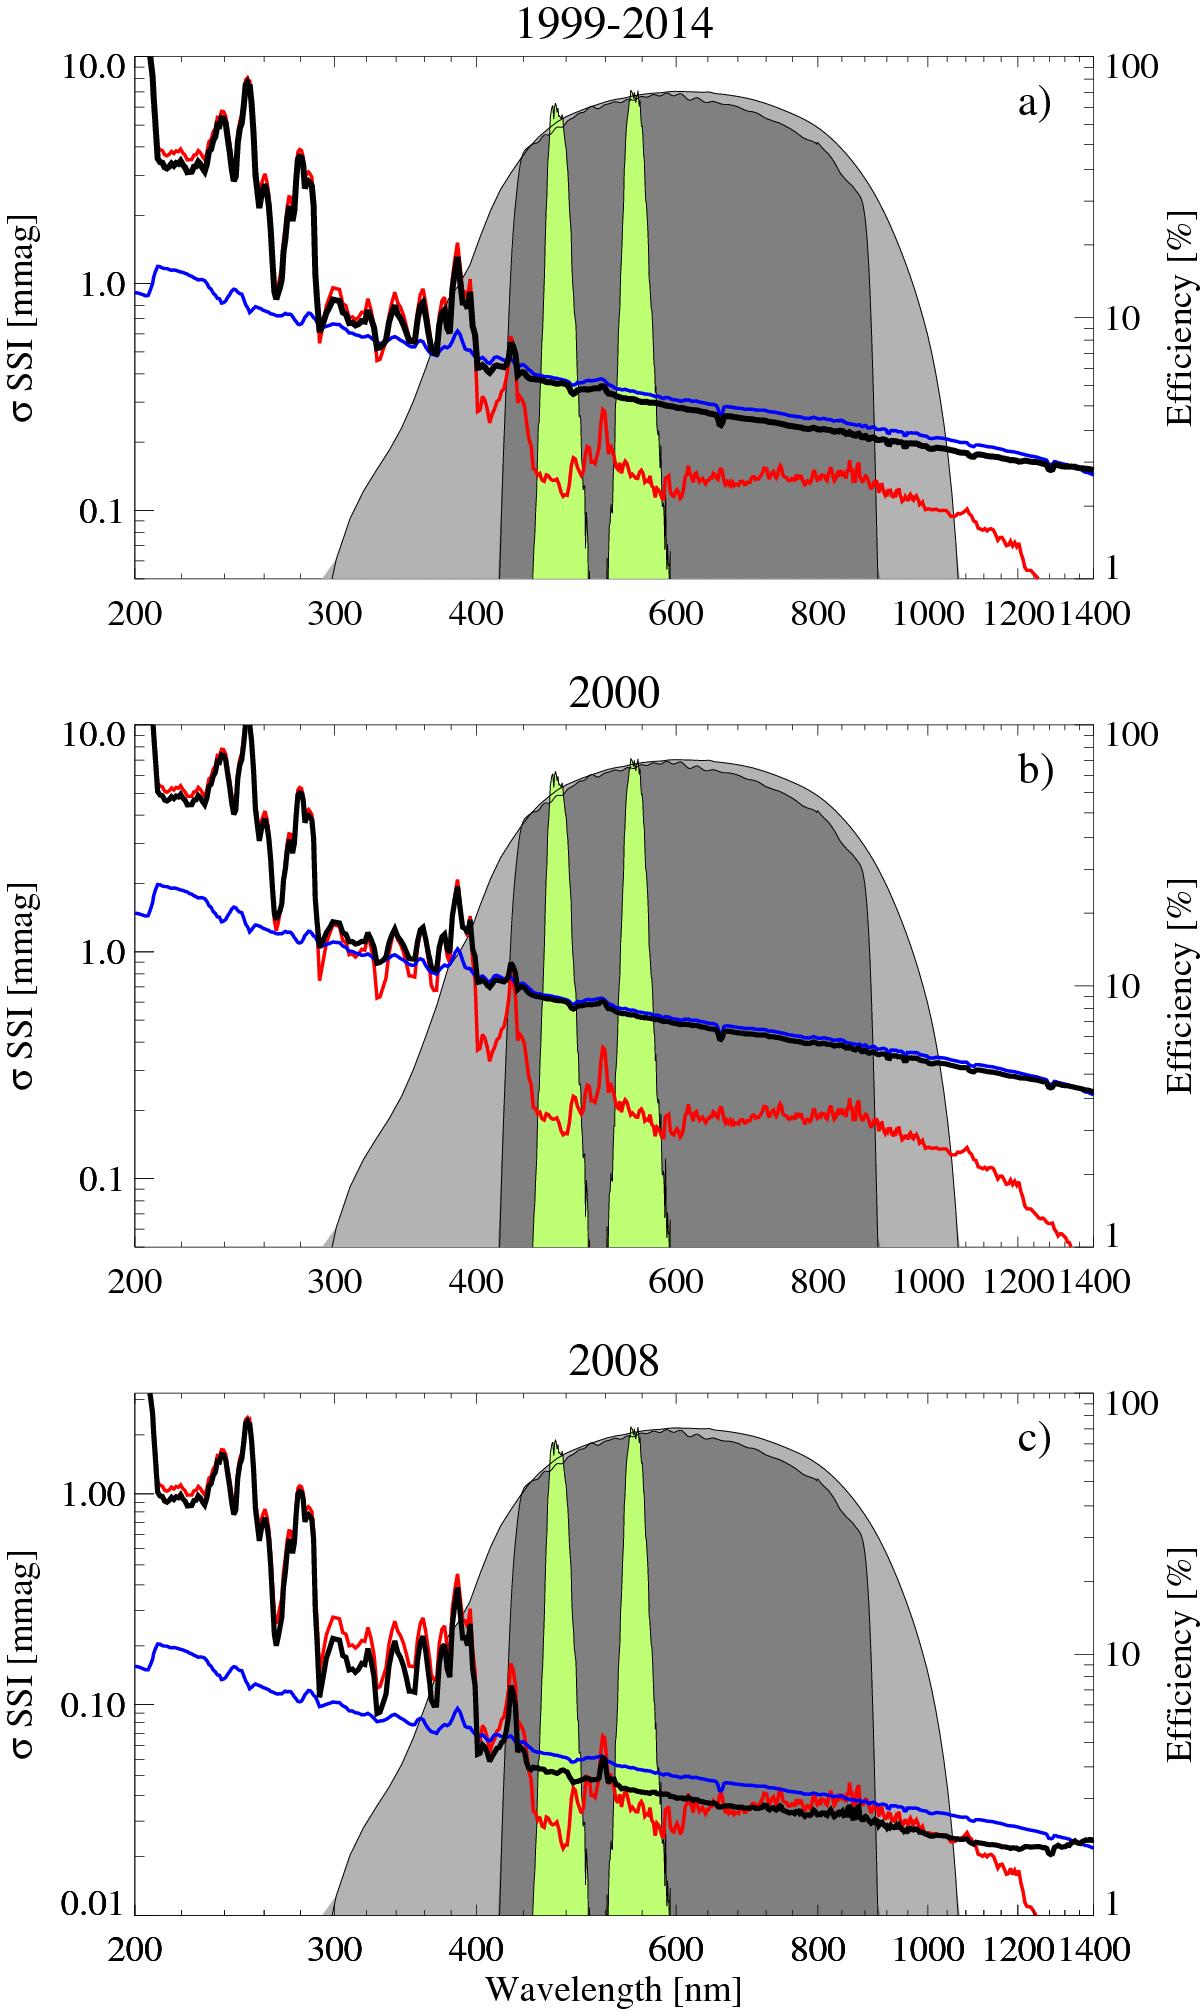
Amplitude of the rotational solar brightness variability (black curves) and its facular (red) and spot (blue) components calculated for the 1999–2014 period (panel a)), as well as averaged over the years 2000 (panel b)) and 2008 (panel c)). The green shaded contours indicate the transmission curves of the Strömgren filters b and y. The dark (light) shaded areas show Kepler (CoRoT) total spectral efficiency.
Current usage metrics show cumulative count of Article Views (full-text article views including HTML views, PDF and ePub downloads, according to the available data) and Abstracts Views on Vision4Press platform.
Data correspond to usage on the plateform after 2015. The current usage metrics is available 48-96 hours after online publication and is updated daily on week days.
Initial download of the metrics may take a while.