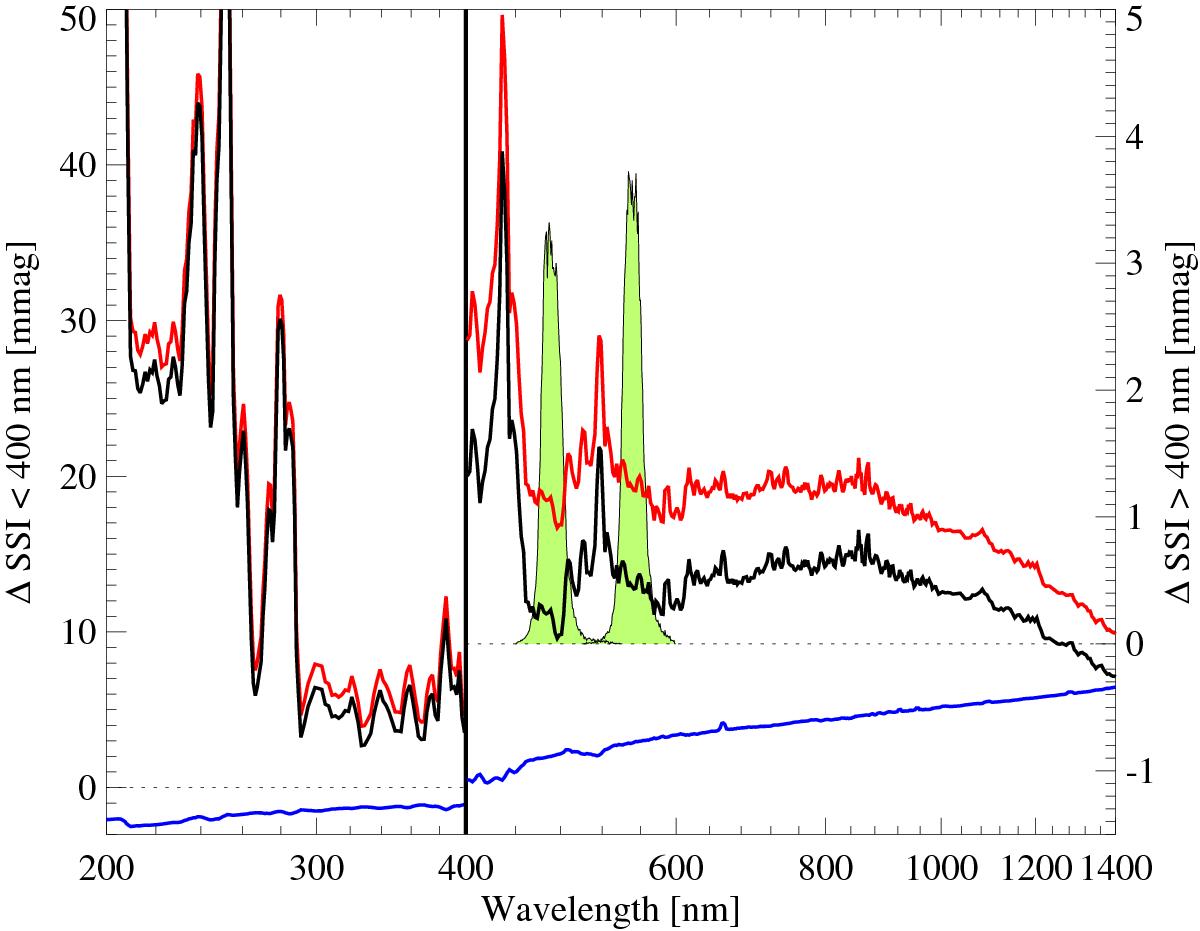
Fig. 3
Amplitude of the 11-year solar brightness variability (black curves) and its facular (red) and spot (blue) components expressed in mmag. We use axes with different scales shortward and longward of 400 nm (left and right parts and Y-axes of the figure, respectively separated by the vertical black line). The green shaded contours indicate the transmission curves of the Strömgren filters b and y (centred at 467 and 547 nm, respectively). The scale for the transmission curves is chosen so that transmission values 0% and 100% correspond to 0 and 5 mmag, respectively (according to the right axis).
Current usage metrics show cumulative count of Article Views (full-text article views including HTML views, PDF and ePub downloads, according to the available data) and Abstracts Views on Vision4Press platform.
Data correspond to usage on the plateform after 2015. The current usage metrics is available 48-96 hours after online publication and is updated daily on week days.
Initial download of the metrics may take a while.