Free Access
Fig. 2
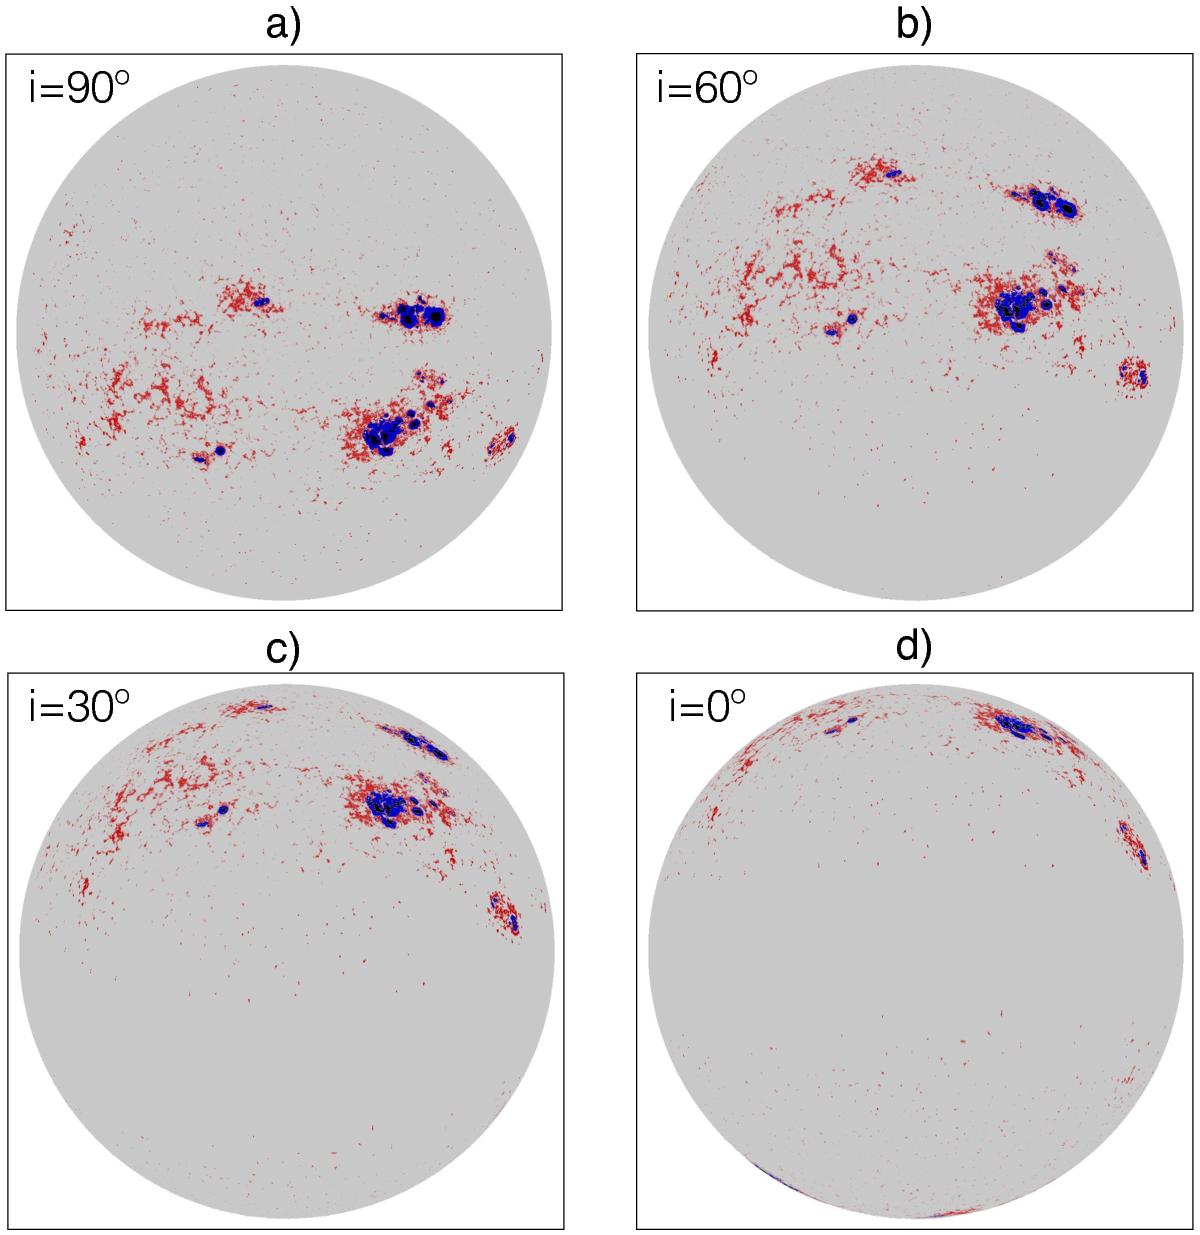
Umbrae (plotted in black), penumbrae (plotted in blue), and faculae and network (both plotted in red) as they would be seen on the solar disc on October 31, 2003 about midnight UTC at four different inclinations: i = 90° (i.e. from the ecliptic plane, panel a)), i = 60° (panel b)), i = 30° (panel c)), and i = 0° (panel d)).
Current usage metrics show cumulative count of Article Views (full-text article views including HTML views, PDF and ePub downloads, according to the available data) and Abstracts Views on Vision4Press platform.
Data correspond to usage on the plateform after 2015. The current usage metrics is available 48-96 hours after online publication and is updated daily on week days.
Initial download of the metrics may take a while.