Fig. A.4
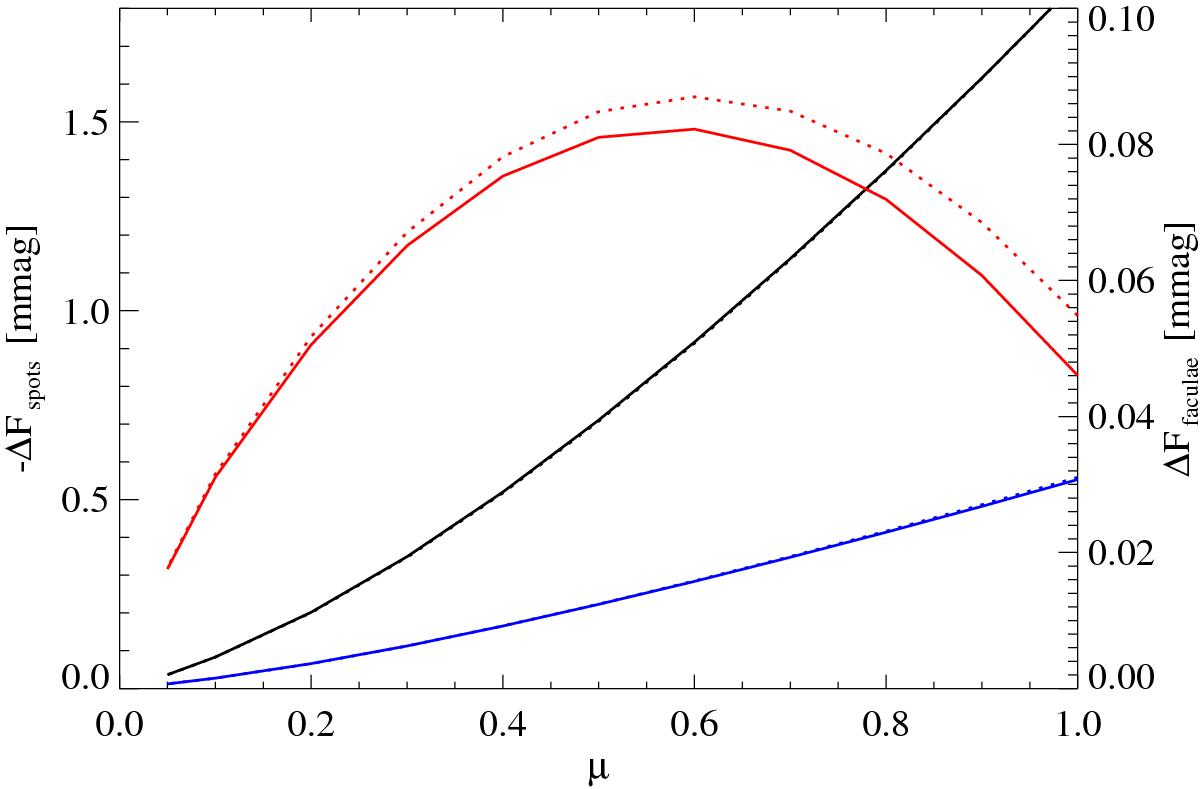
Simulated values of the solar brightness change caused by umbral (black curves), penumbral (blue), and facular (red) feature covering one ppt (part per thousand) of the visible solar surface as functions of the feature position on the visible solar disc. We use axes with different scales for the brightness changes associated with spot and facular features. Solid (dotted) curves correspond to the brightness changes as they would be seen by Kepler (CoRoT).
Current usage metrics show cumulative count of Article Views (full-text article views including HTML views, PDF and ePub downloads, according to the available data) and Abstracts Views on Vision4Press platform.
Data correspond to usage on the plateform after 2015. The current usage metrics is available 48-96 hours after online publication and is updated daily on week days.
Initial download of the metrics may take a while.