Fig. 10
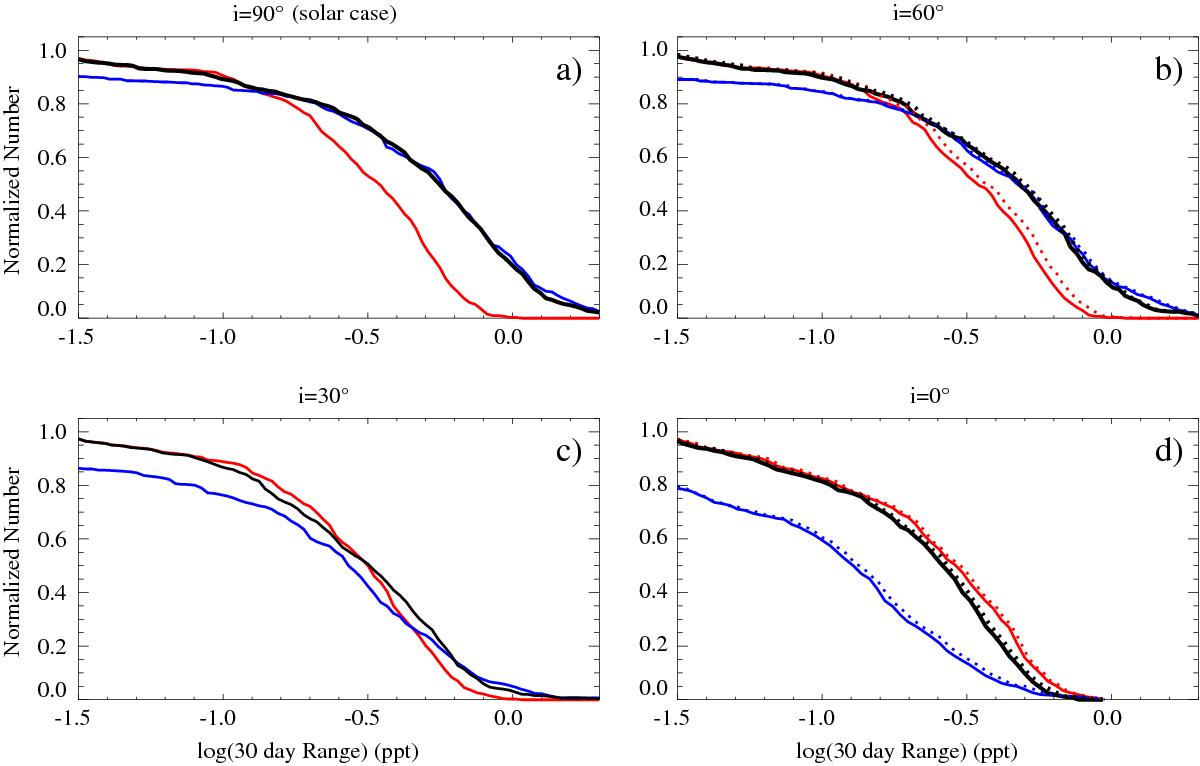
Tail distribution functions (see the definition in the main text) of solar brightness variations as they would be measured by Kepler (solid curves), CoRoT (dotted curves in panel b)), and in Strömgren (b + y)/2 photometry (dotted curves in panel d)). Black, red, and blue curves correspond to total, facular, and spot light curves, respectively. The variations are measured by Rvar(30 days) and are given in parts per thousand (ppt, 1 mmag ≈0.92 ppt). Plotted are the tail distribution functions calculated at four values of solar inclination: i = 90° (panel a)), i = 60° (panel b)), i = 30° (panel c)), and i = 0° (panel d)).
Current usage metrics show cumulative count of Article Views (full-text article views including HTML views, PDF and ePub downloads, according to the available data) and Abstracts Views on Vision4Press platform.
Data correspond to usage on the plateform after 2015. The current usage metrics is available 48-96 hours after online publication and is updated daily on week days.
Initial download of the metrics may take a while.