Fig. 1
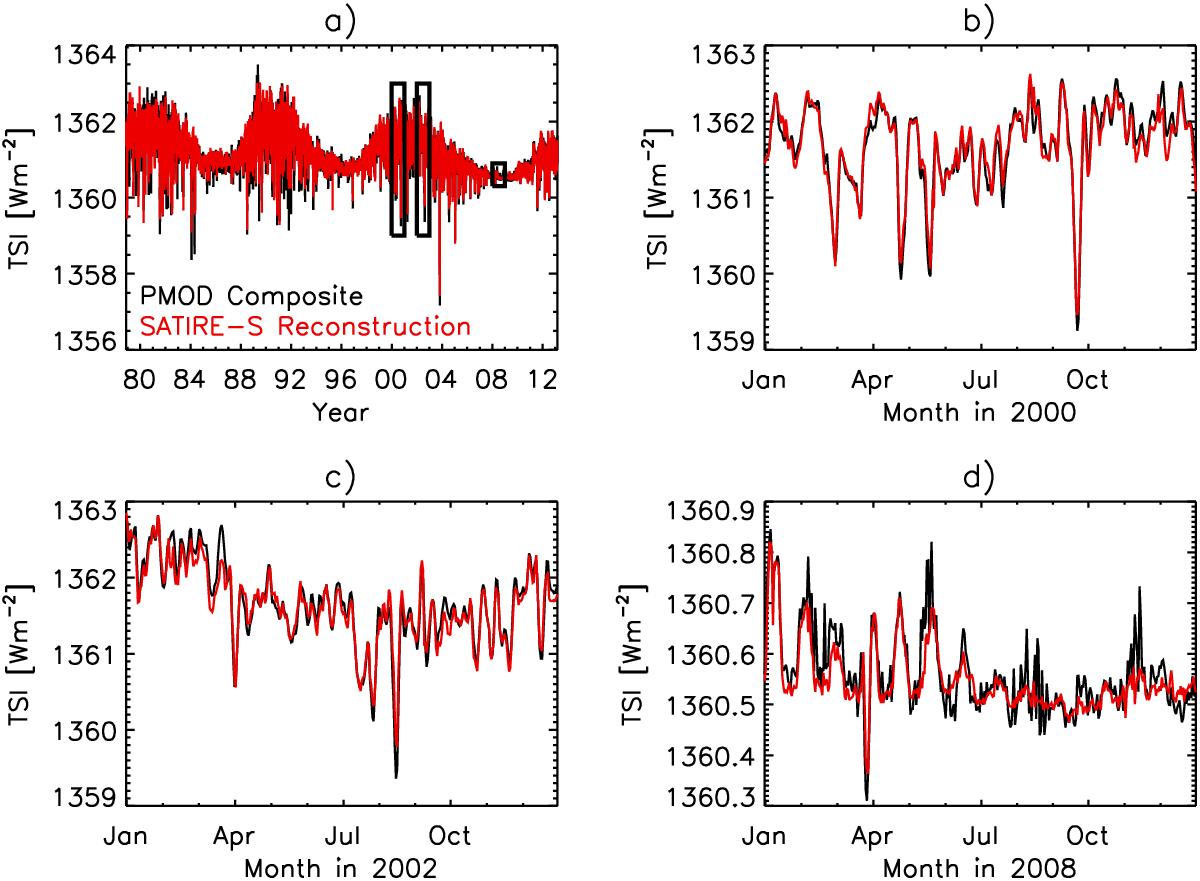
TSI from the SATIRE-S reconstruction (red curves) and from the PMOD composite (black) for the entire period of observations (panel a)), and for the annual intervals representing high (panels b) and c)) and low (panel d)) levels of solar activity. Three black rectangles in panel a) constrain the periods and TSI ranges shown in the other panels. The presented SATIRE-S reconstruction (panel a)) is based on full-disc observations of intensity and magnetic flux from the Kitt Peak Vacuum Telescope, the Michelson Doppler Imager (MDI) onboard the Solar and Heliospheric Observatory, and the Helioseismic and Magnetic Imager onboard the Solar Dynamics Observatory. The parts of the reconstruction displayed in panels b)–d) are based on the MDI data.
Current usage metrics show cumulative count of Article Views (full-text article views including HTML views, PDF and ePub downloads, according to the available data) and Abstracts Views on Vision4Press platform.
Data correspond to usage on the plateform after 2015. The current usage metrics is available 48-96 hours after online publication and is updated daily on week days.
Initial download of the metrics may take a while.