Fig. 5
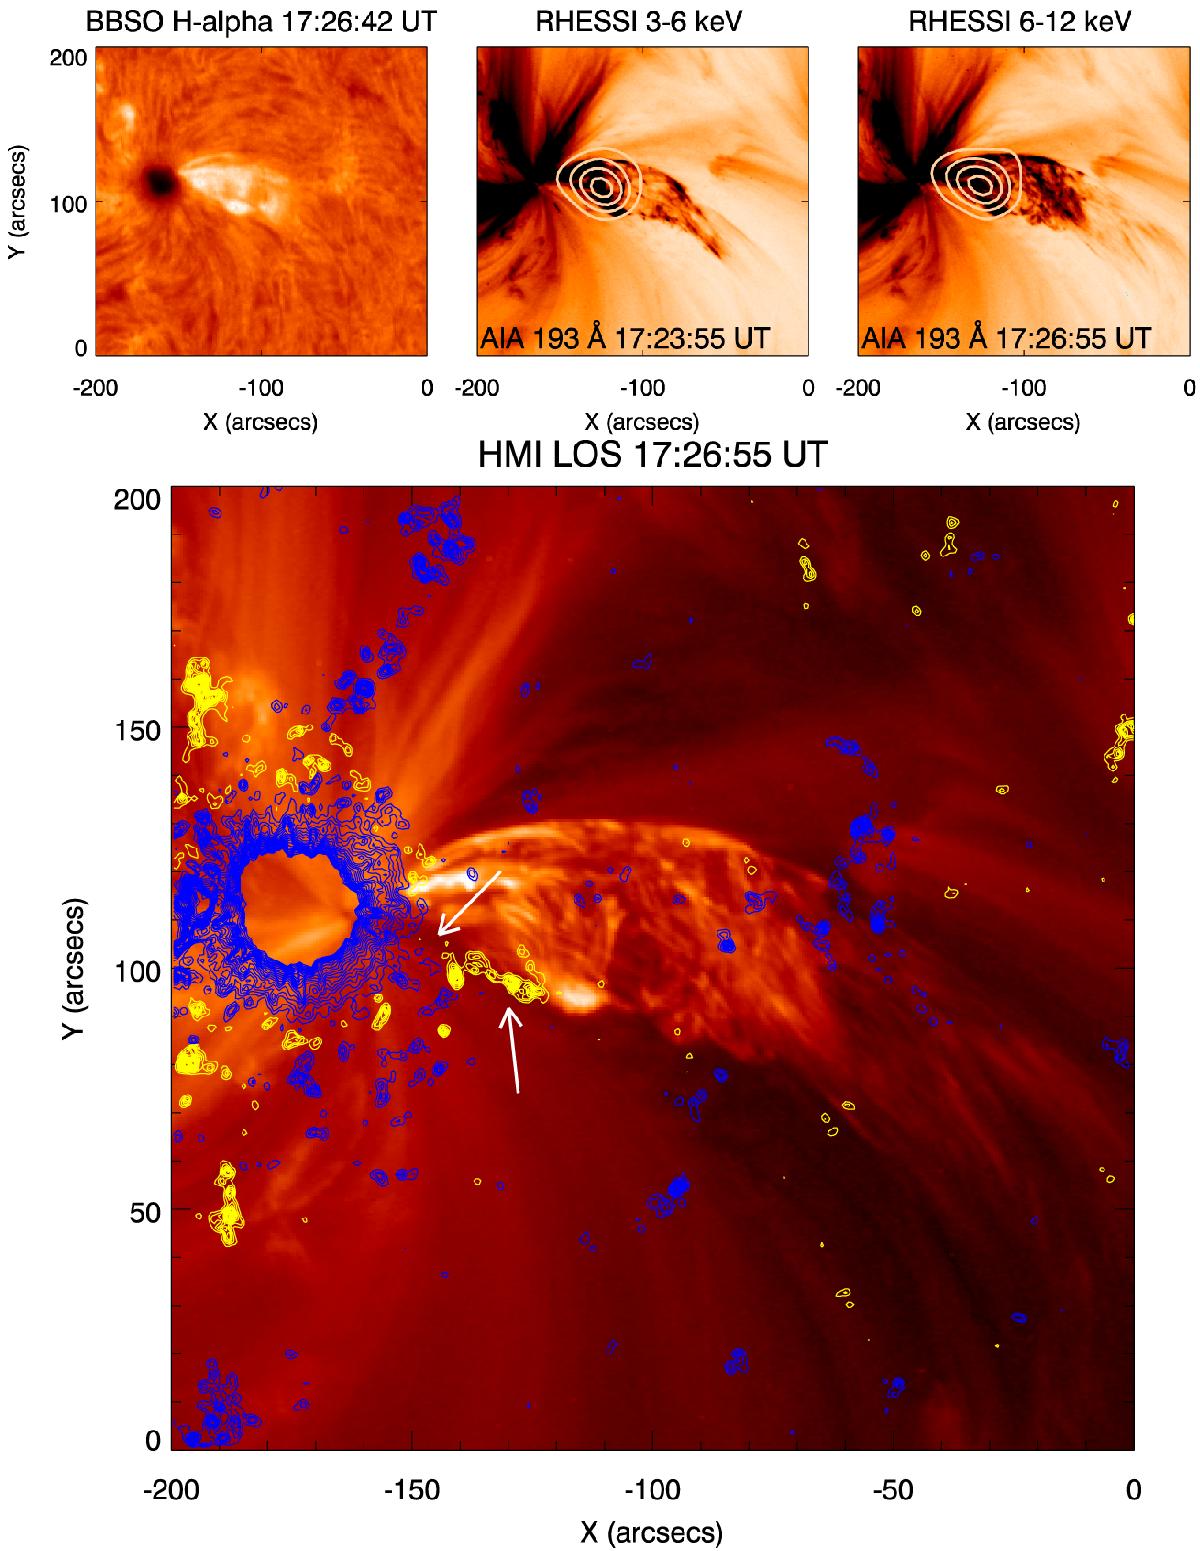
Top left panel: Hα image of the jet at 17:26 UT, observed by the BBSO. Top middle and right panels: the jet in the AIA 193 Å channel (reverse colour image) with 3−6 keV and 6−12 keV RHESSI contours (30, 50 , 70, and 90% of peak flux). Bottom panel: AIA 193 Å image and contours are HMI LOS at 17:26 UT. The blue colour contours represent the negative-polarity sunspot and the yellow contours show the positive-polarity regions.
Current usage metrics show cumulative count of Article Views (full-text article views including HTML views, PDF and ePub downloads, according to the available data) and Abstracts Views on Vision4Press platform.
Data correspond to usage on the plateform after 2015. The current usage metrics is available 48-96 hours after online publication and is updated daily on week days.
Initial download of the metrics may take a while.