Fig. 14
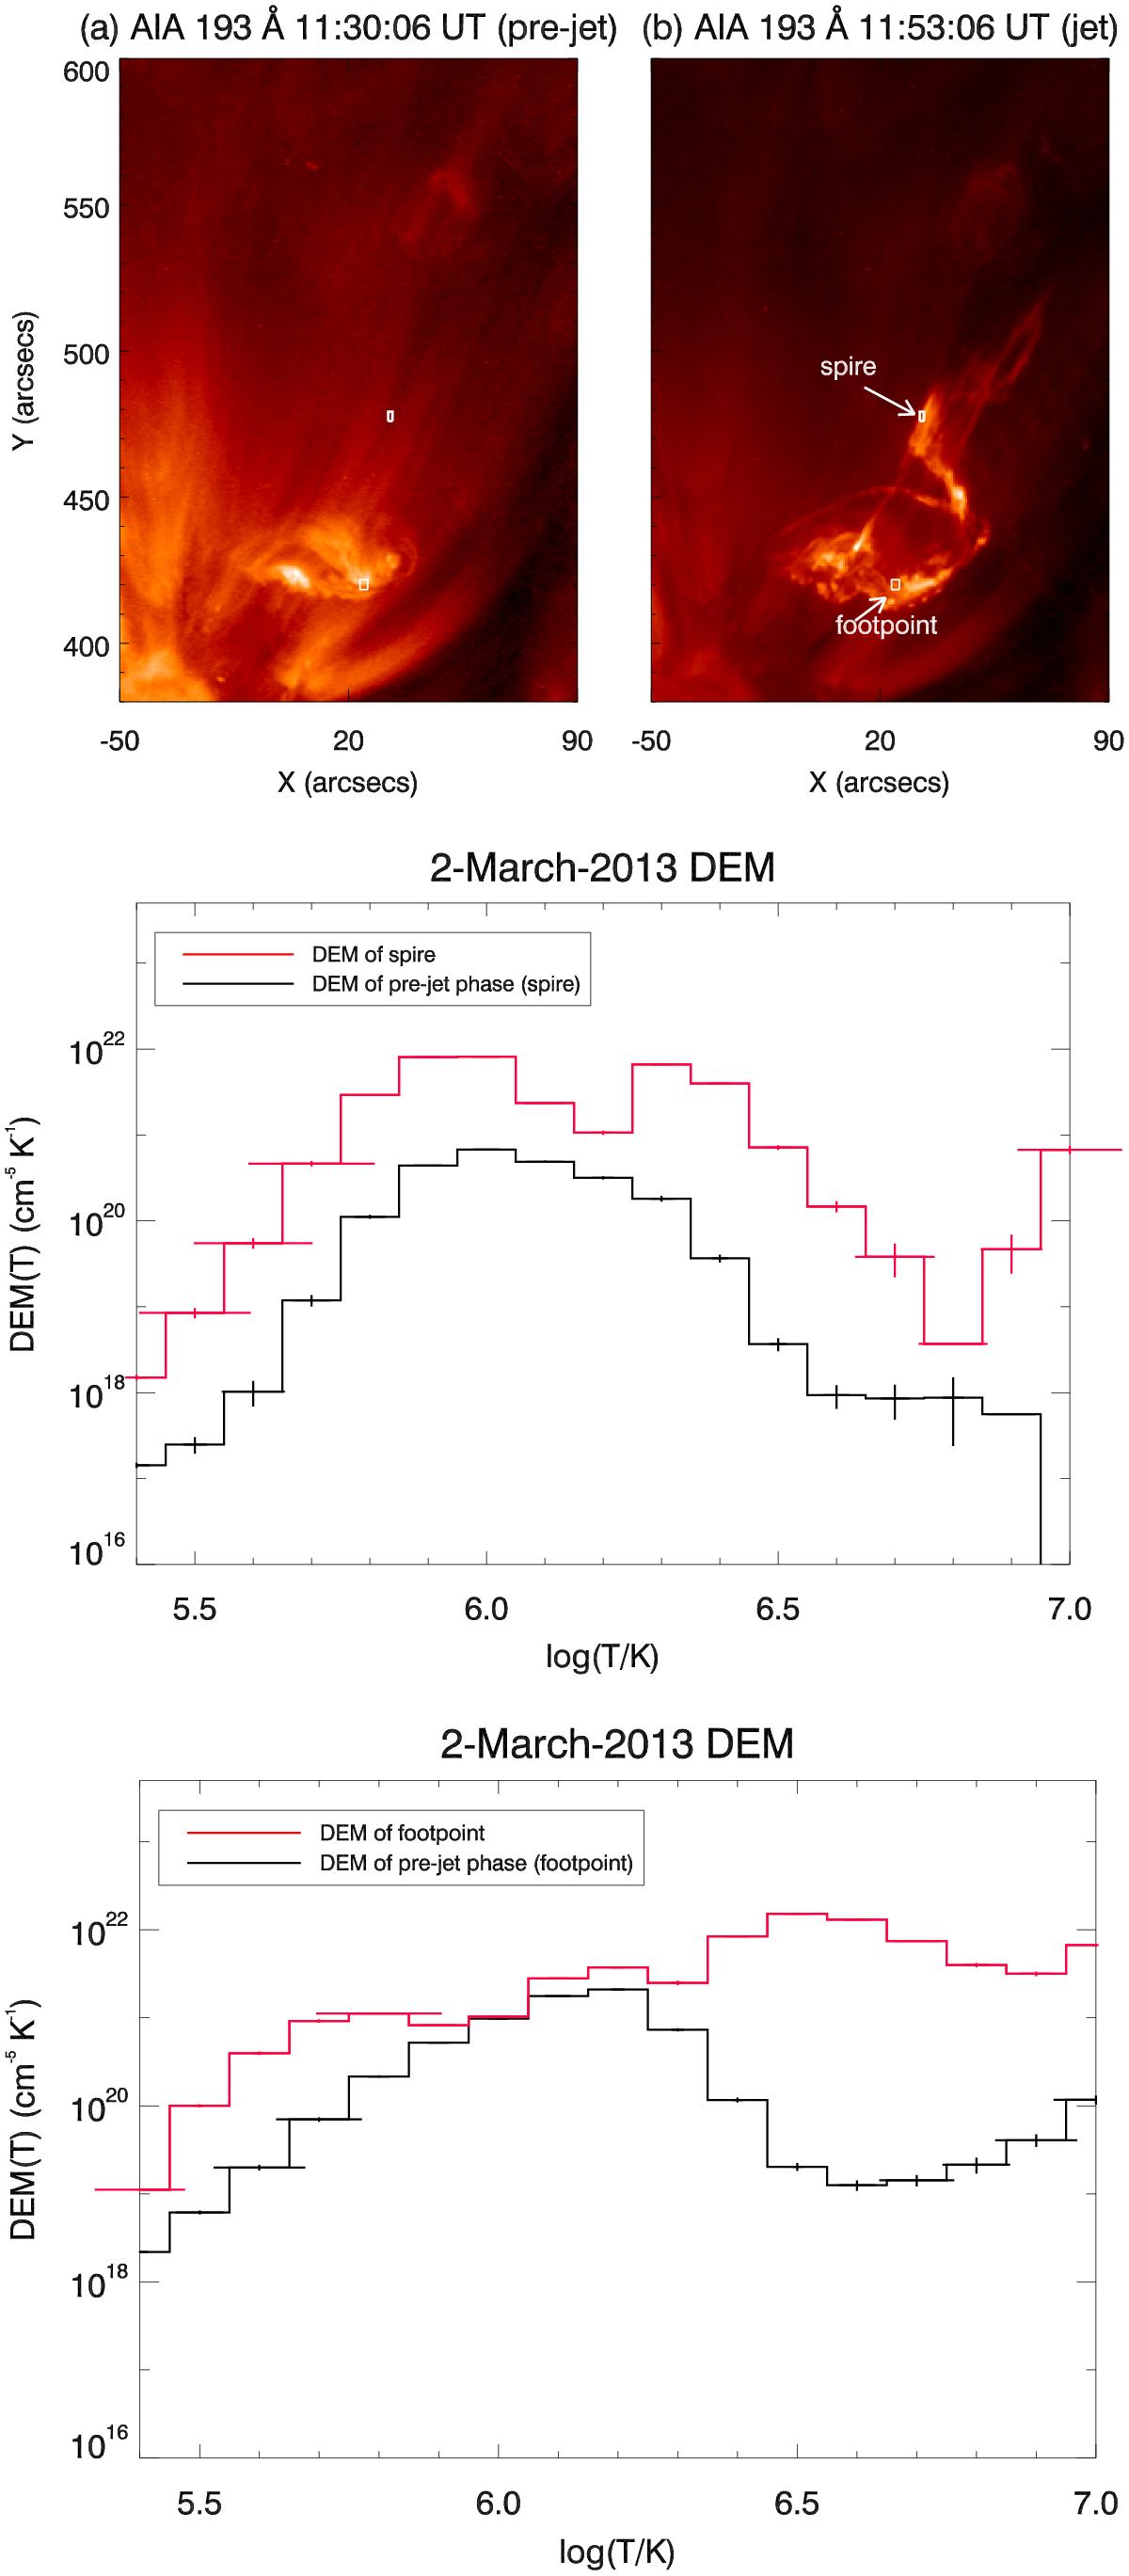
Top panel: AIA 193 Å image of a) pre-jet phase and b) jet. The two regions in the small boxes are used for the DEM analysis. Middle panel: DEM curves for the spire of the jet (red curve) and at the same region during the pre-jet phase (black curve). Bottom panel: DEM curves for the footpoint of the jet (red curve) and, at the same region, during the pre-jet phase (black curve).
Current usage metrics show cumulative count of Article Views (full-text article views including HTML views, PDF and ePub downloads, according to the available data) and Abstracts Views on Vision4Press platform.
Data correspond to usage on the plateform after 2015. The current usage metrics is available 48-96 hours after online publication and is updated daily on week days.
Initial download of the metrics may take a while.