Fig. 3
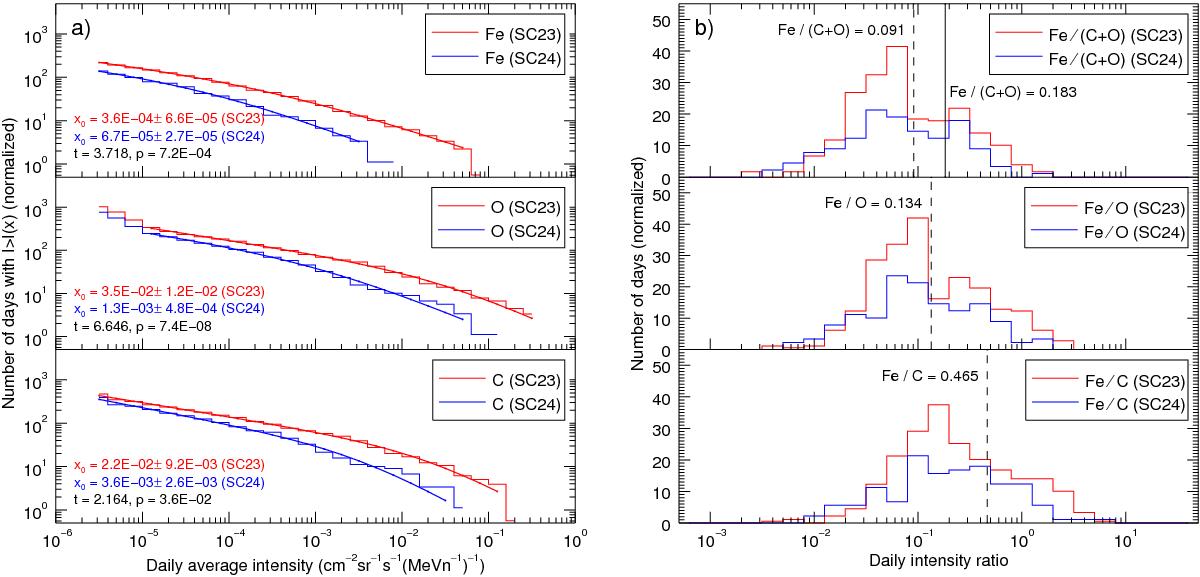
a) Cumulative distribution of daily average intensities of 5–15 MeV n-1 C (bottom), O (middle) and Fe (top). The quantities x0 are the breakpoint intensities of the double power-law fits. Similarly to Fig. 2, the quantities t and p represent a test statistic calculated from the logarithmic difference of the breakpoint intensities and its probability value. b) Distribution of daily average 5–15 MeV n-1 intensity ratios Fe/C (bottom), Fe/O (middle), and Fe/(C+O) (top). The dashed lines show the average values measured in gradual events, and the solid line in the top panel shows the gradual event value multiplied by two. In both figures, the colors and data omission are similar as in Fig. 2. All distributions have been normalized to account for the time SOHO/ERNE has been offline, and the SC23 distributions have been scaled down to account for the difference between the duration of SC23 and the measured duration of SC24 (until 30 June 2015).
Current usage metrics show cumulative count of Article Views (full-text article views including HTML views, PDF and ePub downloads, according to the available data) and Abstracts Views on Vision4Press platform.
Data correspond to usage on the plateform after 2015. The current usage metrics is available 48-96 hours after online publication and is updated daily on week days.
Initial download of the metrics may take a while.