Fig. 2
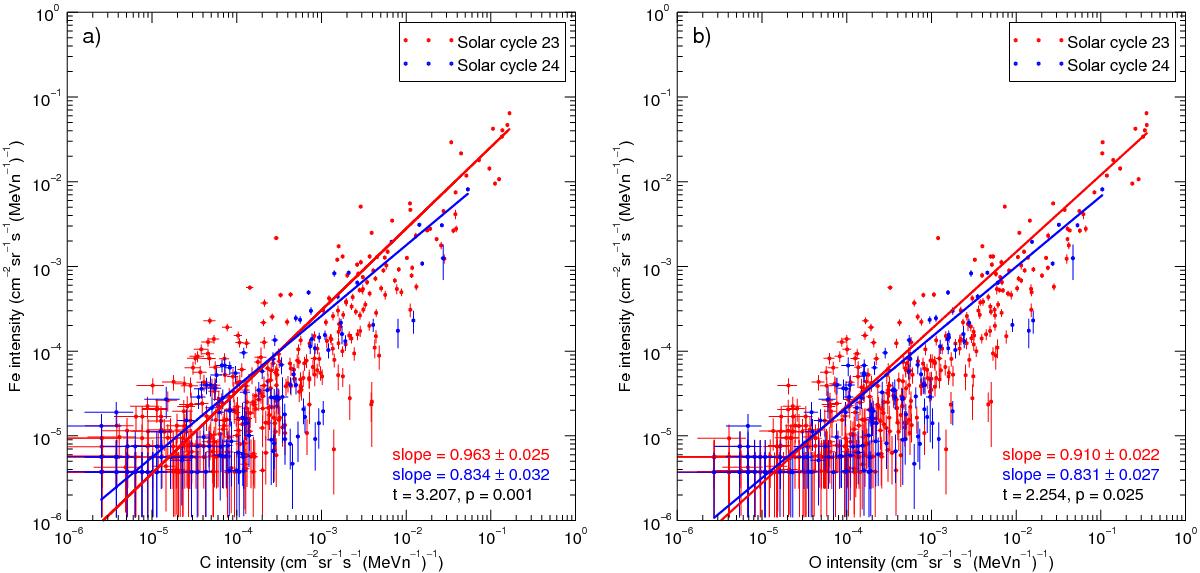
a) Daily average 5–15 MeV n-1 Fe intensities versus daily average C intensities. b) Daily average 5–15 MeV n-1 Fe intensities versus daily average O intensities. In both figures, solar cycle 23 is shown in red and solar cycle 24 in blue. Days with fewer than two detected counts of C, O, or Fe are omitted. Linear fits in log-log scales and their slopes are shown. The quantities t and p represent a test statistic calculated for the difference of the slopes and the probability that such a difference would occur by chance. See Appendix A for details on the fitting and statistical testing.
Current usage metrics show cumulative count of Article Views (full-text article views including HTML views, PDF and ePub downloads, according to the available data) and Abstracts Views on Vision4Press platform.
Data correspond to usage on the plateform after 2015. The current usage metrics is available 48-96 hours after online publication and is updated daily on week days.
Initial download of the metrics may take a while.